The Best Day Trading Indicators For Consistent Profits
Click Here To Save Time
Time Saver
– Utilizing the right technical indicators can significantly enhance decision-making in day trading, leading to consistent profits.
– Both Simple Moving Average (SMA) and Exponential Moving Average (EMA) are crucial for identifying trends and making informed trade decisions.
– A momentum oscillator that helps traders identify overbought or oversold market conditions, providing clear entry and exit points.
– MACD and Bollinger Bands are essential for spotting potential buy/sell signals and understanding market volatility.
– VWAP is a key tool for institutional traders to execute large orders at optimal prices without impacting the market.
– A combination of different indicators, such as MA, RSI, and CCI, can offer a comprehensive view of trading opportunities, enhancing trading strategies.
Introduction
Day trading, a fast-paced trading strategy involving the buying and selling of financial instruments within the same day, requires precise decision-making.
The ability to make quick, informed decisions can be the difference between profit and loss. One of the most effective ways to refine your decision-making process is through the use of technical indicators.
These tools analyze market data like price, volume, and trends, providing traders with insights into potential trading opportunities.
This article explores some of the most effective day trading indicators that can help traders achieve consistent profits. We’ll discuss how these indicators work, provide practical examples, and examine case studies demonstrating their use in real trading scenarios.
Moving Averages
Moving averages are a staple in the toolbox of any day trader, valued for their simplicity and reliability.
They work by smoothing out price data, creating a single line that makes it easier to identify the overall trend of the market.
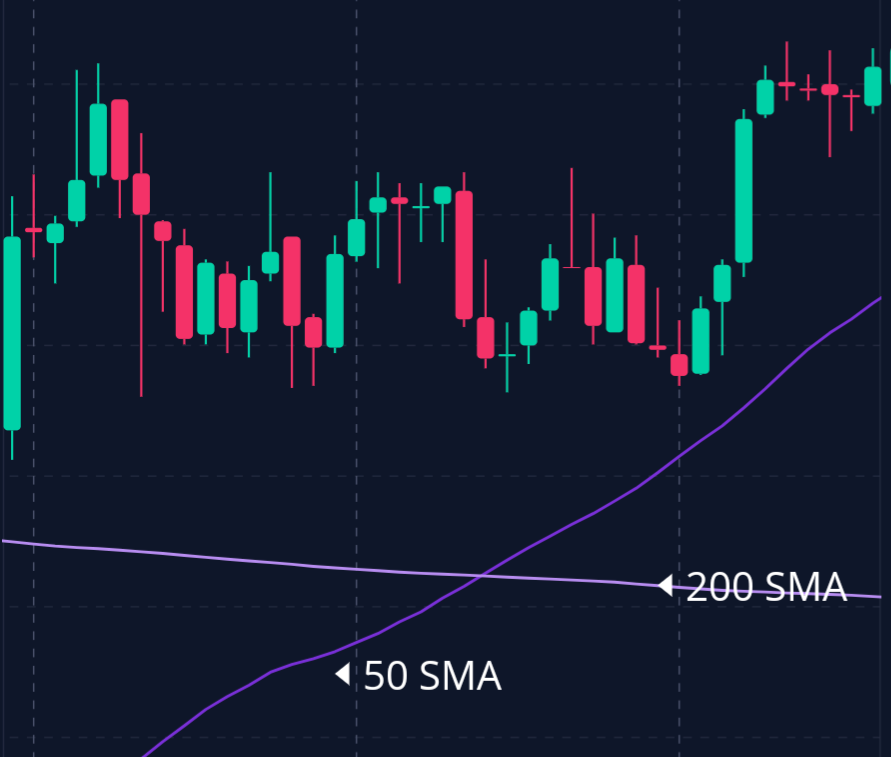
Simple Moving Average
The Simple Moving Average (SMA) is calculated by averaging the closing prices over a set number of periods.
For example, a 50-day SMA represents the average closing prices over the last 50 days, providing a clear picture of the overall trend.
Example:
Imagine a stock that has been trending upwards over the last 20 days. A 20-day SMA would show a smooth, upward-sloping line, signaling a strong trend.
A trader might use this trend as a cue to take a long position, expecting the price to continue rising.
Exponential Moving Average
The Exponential Moving Average (EMA) is similar to the SMA but gives more weight to recent prices, making it more responsive to new information. This responsiveness is particularly valuable in fast-moving markets.
Case Study:
A trader monitoring a tech stock uses a 50-day EMA.
When the EMA responds quickly to a price drop, it signals an exit point, allowing the trader to sell before the stock falls further, thus preserving capital for future trades.
Relative Strength Index
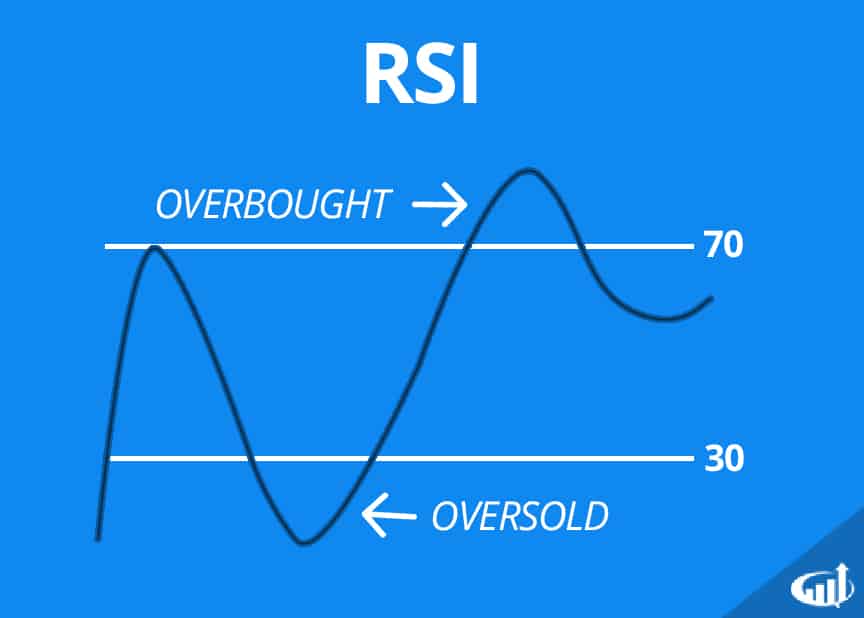
The Relative Strength Index (RSI) is a momentum oscillator that measures the speed and change of price movements. Ranging from 0 to 100, the RSI helps traders identify overbought or oversold conditions in the market.
Understanding RSI Values
– Above 70: Indicates an overbought condition, suggesting the potential for a price pullback.
– Below 30: Suggests an oversold condition, indicating a possible rebound.
Example:
A trader observes a stock with an RSI of 75. This high RSI level suggests the stock might be overbought and due for a correction.
The trader could choose to short the stock or avoid entering a new long position.
Case Study:
A trader spots an oversold stock with an RSI of 25 and anticipates a rebound.
They enter a long position, and as expected, the stock recovers within hours, resulting in a profitable trade.
Moving Average Convergence Divergence
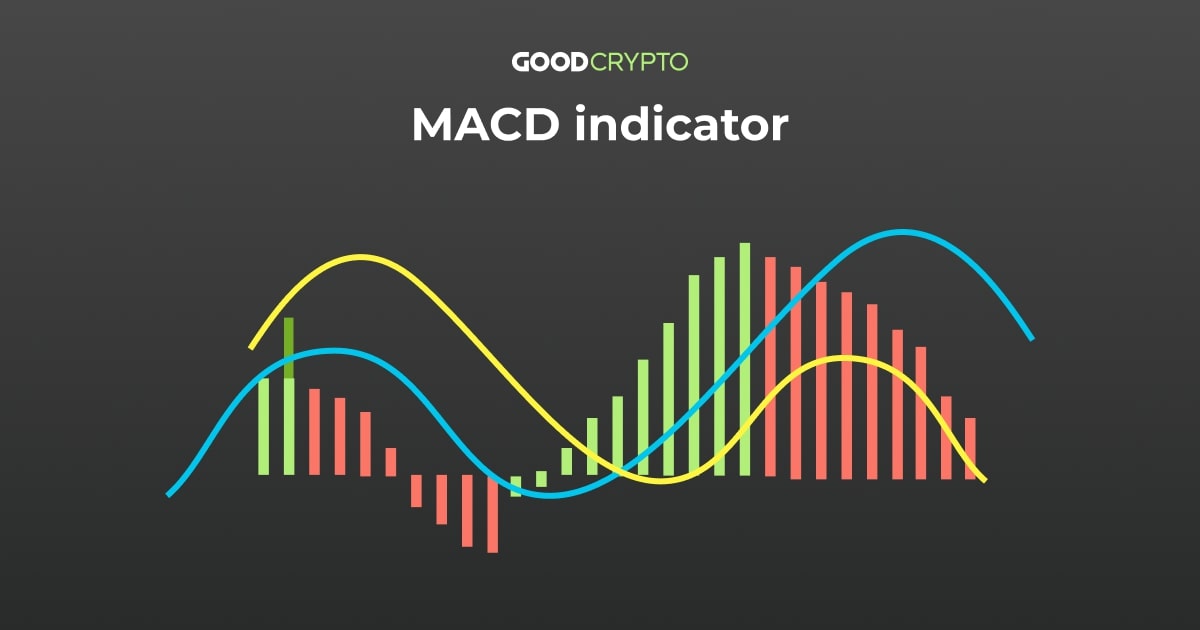
The MACD is a trend-following indicator that shows the relationship between two moving averages of a security’s price.
It’s calculated by subtracting the 26-period EMA from the 12-period EMA.
MACD Components
– MACD Line: The difference between the 12-day and 26-day EMA.
– Signal Line: A 9-day EMA of the MACD Line.
– Histogram: The difference between the MACD Line and the Signal Line.
Using MACD in Day Trading
The MACD is particularly useful for identifying potential buy and sell signals.
A bullish signal occurs when the MACD Line crosses above the Signal Line, while a bearish signal happens when the MACD Line crosses below.
Example:
A trader notices the MACD Line crossing above the Signal Line on a currency pair, signaling a bullish trend.
They decide to buy the currency pair and close the position at a profit as the trend continues.
Case Study:
Monitoring a 5-minute chart, a trader sees a MACD crossover indicating a bullish trend on a stock.
The stock rises by 3% over two hours, and the trader exits with a solid profit.
Bollinger Bands
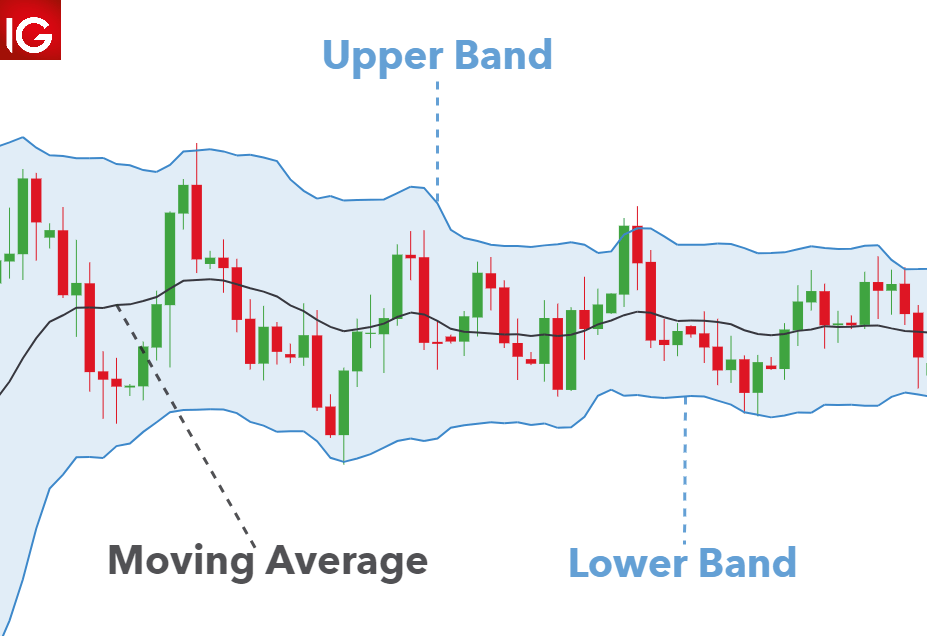
Bollinger Bands consist of three lines: a simple moving average (middle band) and two standard deviations (upper and lower bands) plotted above and below the SMA.
They are particularly useful for identifying overbought and oversold conditions in volatile markets.
Bollinger Band Squeeze
A Bollinger Band Squeeze occurs when the bands contract, indicating low volatility. This squeeze often precedes a significant price movement.
Example:
A trader notices a Bollinger Band Squeeze on a tech stock trading in a tight range. Expecting a breakout, they set up a long position. When the breakout occurs, they profit from the upward momentum.
Case Study:
In a high-volatility market, a trader uses Bollinger Bands on a 15-minute chart to identify an overbought condition.
As the price touches the upper band, they sell the stock short, anticipating a reversal. The stock declines, resulting in a profitable trade.
Commodity Channel Index
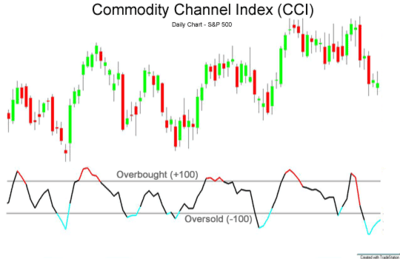
The Commodity Channel Index (CCI) is a versatile indicator that can identify cyclical trends in various markets.
It measures the difference between a security’s current price and its historical average price.
Understanding CCI Values
– Above +100: Indicates that the asset is overbought, suggesting a potential downward correction.
– Below -100: Suggests that the asset is oversold, possibly indicating an upcoming rebound.
Using CCI in Day Trading
The CCI is particularly useful for identifying overbought and oversold levels in volatile markets.
Traders often use it alongside other indicators to confirm trends or reversal points.
Example:
A trader sees that a stock’s CCI has risen above +100, indicating it might be overbought.
After confirming this with other indicators like the RSI, they decide to short the stock, expecting a correction.
As predicted, the stock price drops, and the trader exits with a profit.
Case Study:
A day trader notices that the CCI for a currency pair has dropped below -100, signaling an oversold condition.
They enter a long position, and the currency rallies, allowing the trader to close at a favorable price.
Volume Weighted Average Price
VWAP is a trading benchmark that provides the average price at which a security has traded throughout the day, based on both volume and price.
It is especially useful for institutional traders who need to execute large orders without moving the market.
VWAP as Support and Resistance
VWAP can act as a support or resistance level, similar to moving averages.
A price above the VWAP is considered bullish, while a price below is bearish.
Example:
A trader uses VWAP to identify a support level on a declining stock.
The price touches the VWAP and rebounds, providing a buying opportunity.
The trader enters a long position and profits from the subsequent rally.
Case Study:
An institutional trader needs to buy a large number of shares without driving the price up.
They use VWAP to ensure they are buying at a fair price. By placing their orders close to the VWAP, they minimize market impact and acquire the shares without significant slippage.
Fibonacci Retracement
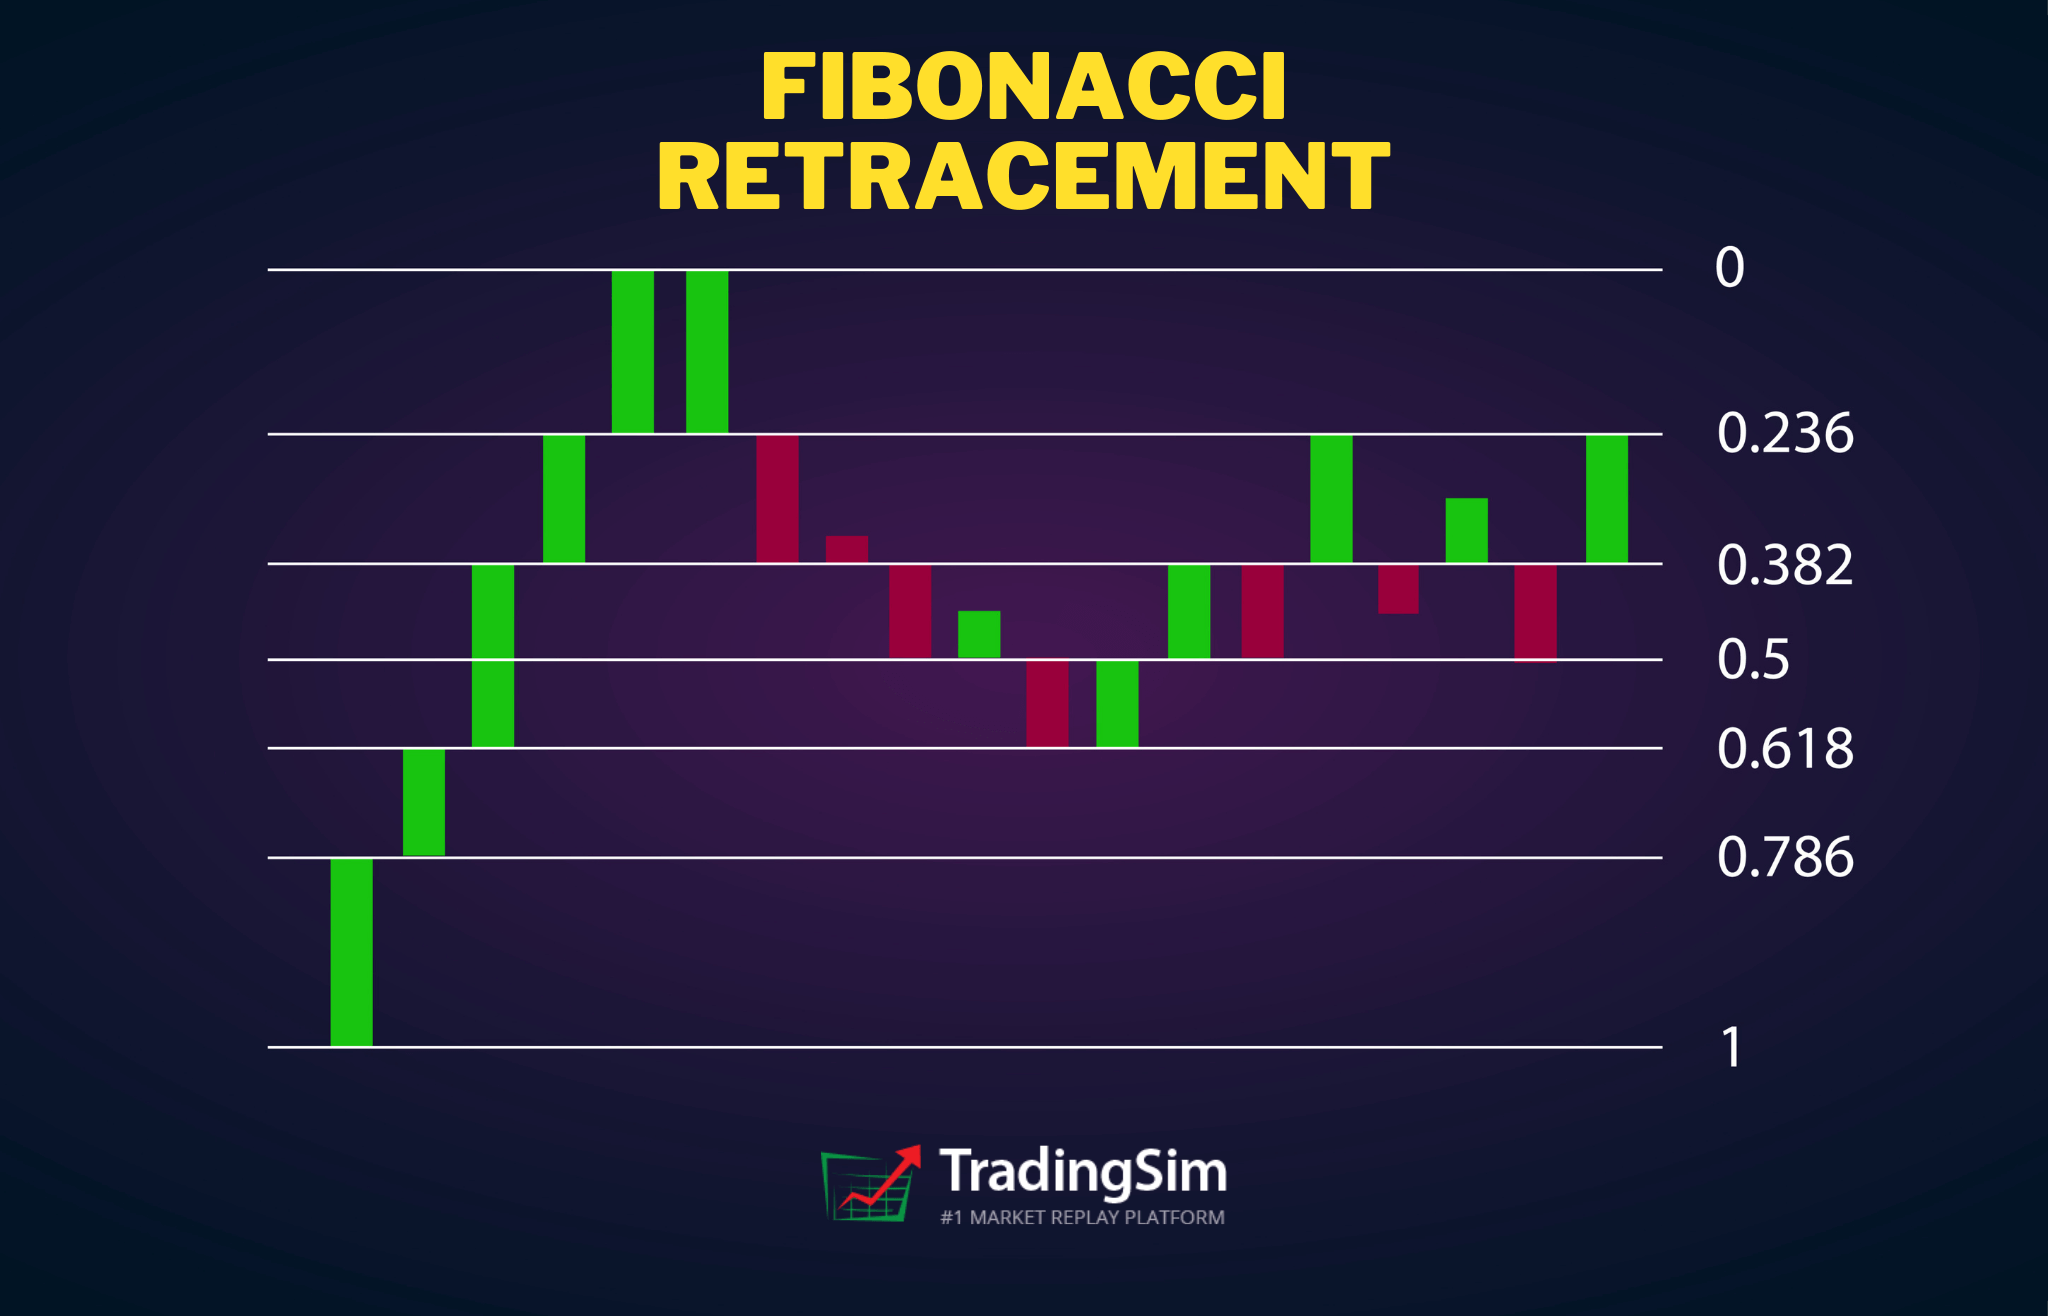
Fibonacci retracement is a tool that helps traders identify potential reversal levels.
It is based on the principle that markets often retrace a predictable portion of a move before continuing in the original direction.
Fibonacci Levels
The key Fibonacci levels are 23.6%, 38.2%, 50%, 61.8%, and 78.6%. These levels often act as support or resistance where the price may reverse.
Example:
A trader observes that a stock has retraced 38.2% of its previous rally. They use this Fibonacci level as an entry point for a long trade.
The stock resumes its upward movement, resulting in a profitable trade.
Case Study:
A currency trader uses Fibonacci retracement levels on a downtrending currency pair.
The pair retraces to the 61.8% level, where the trader enters a short position. The pair continues to decline, resulting in a successful trade.
Conclusion
Day trading demands quick and informed decisions. The right indicators can significantly enhance a trader’s ability to consistently make profitable trades.
Understanding and utilizing indicators like Moving Averages, RSI, MACD, Bollinger Bands, CCI, VWAP, and Fibonacci Retracement can improve your chances of success.
Each of these indicators offers unique insights into market conditions.
When combined, they provide a comprehensive view of potential trading opportunities.
However, no single indicator guarantees success. It’s important to practice using these tools in a simulated environment to understand their performance under various market conditions.
Click Here For Our Sources
Sources
https://www.investopedia.com/articles/active-trading/040116/best-indicators-day-trading.asp
https://www.babypips.com/learn/forex/best-forex-trading-indicators
https://www.tradingview.com/ideas/indicators
https://www.ig.com/en/trading-strategies/best-technical-indicators-for-day-trading-190709
Leave a Reply
You must be logged in to post a comment.