Mastering Candlesticks: A Complete Overview

Click Here To Save Time
Time Saver
Candlesticks are a core tool in technical analysis, showing price action over a certain time frame and are used by day traders and investors.
Each candlestick is made up of the open, high, low, close and body which shows market trends and potential reversals.
There are bullish, bearish and neutral candlesticks and specific patterns like Engulfing, Hammer and Doji Candlesticks.
Pole Patterns, Channel or Range Patterns and Trend Patterns are important for price action and market sentiment.
Volume is important in candlestick analysis, higher volume confirms the candlestick or pattern.
Knowing consolidation, fake-outs and the psychology of candlesticks will help you in your stock market trading.
How To Read A Candlestick
What Is A Candlestick?
Candlesticks are a type of technical indicator that both day traders and investors use. Candlesticks were originally developed in the 18th century Japan by rice trader Munehisa Homma to track price movements.
Today they are the foundation of technical analysis in the stock market and it is used by day traders and investors. Each candlestick on a chart represents the price action over a certain period of time previously set by the day trader or investor.
Candlesticks are made up of 5 parts: the open price, high price, low price, close price and body . This visual representation helps traders and investors identify trends and reversals, making candlesticks a key tool in day trading, investing and market analysis. If you are in the stock market and want to make informed decisions based on historical price action then you need to understand candlesticks.
What Makes Up A Candlestick?
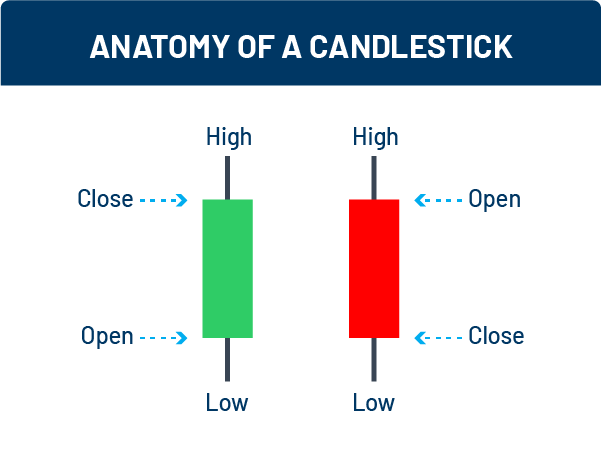
High Price or “Upper Wick” – This is the highest price that the asset has traveled in a specified amount of time previously set by the day trader or investor.
Open Price – This is the price of the FIRST trade that was made in a specified amount of time previously set by the day trader or investor.
Close Price – This is the price of the LAST trade that was made in a specified amount of time previously set by the day trader or investor.
Low Price or “Lower Wick” – This is the lowest price that the asset has traveled in a specified amount of time previously set by the day trader or investor.
Body – This is the green or red part of the candlestick that tells the day trader or investor whether the candlestick is a bullish candlestick or bearish candlestick.
Types Of Candlesticks
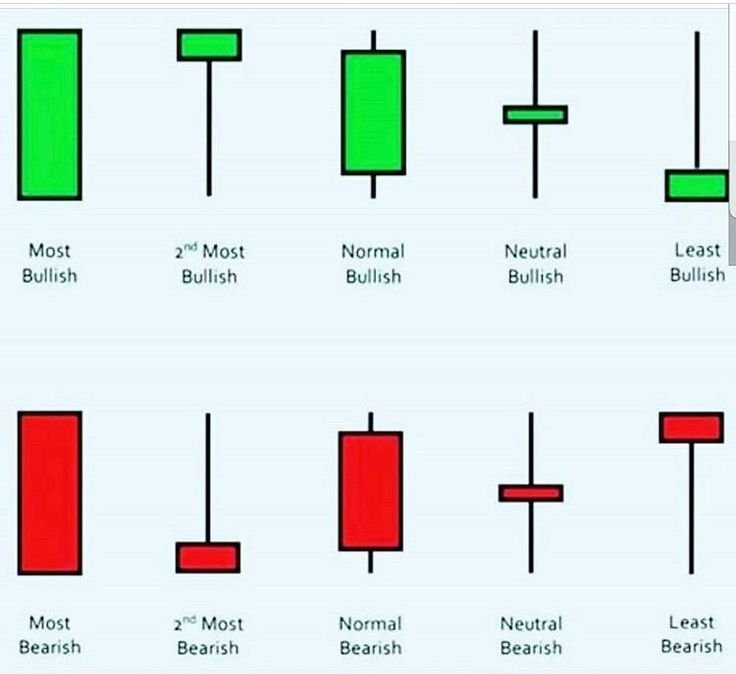
There are an insane amount of different candlesticks that are available to learn. While under normal circumstances, the more you know, the better you are. When it comes to understanding candlesticks, however, there are only three different types of candlesticks you need know: Bullish Candlesticks, Bearish Candlesticks, and Neutral Candlesticks.
Under these three types of candlesticks are three specific, individual, candlesticks. Now don’t worry, the bullish and bearish candlesticks are the exact same just differing in color. The individual candlesticks you need to know are: Engulfing Candlesticks, Hammer Candlesticks, and Doji Candlesticks.
Bullish Candlesticks
Bullish Engulfing Candlestick – Bullish engulfing candlesticks are candlesticks where the entire body of the candlestick “engulfs”, or completely covers, the previous candlestick. These candlesticks typically appear AFTER a bearish candlestick. This candlestick’s OPEN price is BELOW the previous candlestick’s CLOSE price and the CLOSE price is ABOVE the previous candlestick’s OPEN price.
Bullish Hammer Candlestick – Bullish hammer candlesticks are candlesticks that look like a hammer and are typically candlesticks that represent a potential bottom in a downtrend. These candlesticks have a very small, or no, UPPER WICK, small BODY, and a very long LOWER WICK that is at least TWICE the size of the BODY.
Bullish Doji Candlestick – Bullish doji candlesticks are candlesticks that represent a potential bottom or reversal of a downtrend. These types of candlesticks act very similar to a bullish hammer candlestick, however, these candlesticks are more of an indecision of price rather than a single direction. These candlesticks have either a very long or very short UPPER WICK with an equal LOWER WICK. The BODY of these candlesticks are either half the size, or equal to, the size of the WICKS.
Bearish Candlesticks
Bearish Engulfing Candlestick – Bearish engulfing candlesticks are candlesticks where the entire body of the candlestick “engulfs”, or completely covers, the previous candlestick. These candlesticks typically appear AFTER a bullish candlestick. This candlestick’s CLOSE price is ABOVE the previous candlestick’s OPEN price and the OPEN price is BELOW the previous candlestick’s CLOSE price.
Bearish Hammer Candlestick – Bearish hammer candlesticks are candlesticks that look like a hammer and are typically candlesticks that represent a potential top in an uptrend. These candlesticks have a very small, or no, UPPER WICK, small BODY, and a very long LOWER WICK that is at least TWICE the size of the BODY.
Bearish Doji Candlestick – Bearish doji candlesticks are candlesticks that represent a potential top or reversal of an uptrend. These types of candlesticks act very similar to a bearish hammer candlestick, however, these candlesticks are more of an indecision of price rather than a single direction. These candlesticks have either a very long or very short UPPER WICK with an equal LOWER WICK. The BODY of these candlesticks are either half the size, or equal to, the size of the WICKS.
Neutral Candlesticks
Neutral Doji Candlestick – Neutral doji candlesticks are candlesticks that can represent a potential move. These types of candlesticks act just like the regular doji candlestick, however, these candlesticks are more of an indecision of price in a consolidation, or pause, in the price rather than in the trend itself. The BODY of these candlesticks DO NOT MATTER and it is more dependent on where the candlestick is. These candlesticks have either a very long or very short UPPER WICK with an equal LOWER WICK. The BODY of these candlesticks are either half the size, or equal to, the size of the WICKS.
Candlestick Patterns
There are an insane amount of different candlestick patterns that are available to learn. While under normal circumstances, the more you know, the better you are. When it comes to understanding candlestick patterns, however, there are only three different types of candlestick patterns you need know: Bullish Candlestick Patterns, Bearish Candlestick Patterns, and Neutral Candlestick Patterns.
Under these three types of candlestick patterns are three specific, individual, candlestick patterns. Now don’t worry, the bullish and bearish candlesticks are the exact same principle, just the opposite direction. The individual candlestick patterns you need to know are: Pole Patterns, Range or Channel Patterns, and Trend Patterns.
What Is A Candlestick Pattern?

A candlestick pattern is a fundamental concept in day trading, technical analysis and investing. It’s a single candlestick that shows the open, close, high and low of a stock over a specific time frame. These candlestick patterns are a simple yet powerful way to see market trends and price movements.
Originated from Japanese rice traders in the 18th century, these candlestick patterns are now an essential tool for modern day traders and investors in the stock market. Candlestick patterns are used to predict future price movements by looking at the shape and color of the candles, to see market sentiment and potential reversals.
They are used in all financial markets today for their ability to give a clear visual of price action, so day traders and investors can make informed decisions based on historical and current market data.
Bullish Candlestick Patterns
Bullish Pole Pattern – Bullish pole patterns are commonly known as “Bull Flags” and “Bull Pennants” but are the same exact concept so they are grouped as “Bull Pole” patterns. These patters occur after a strong upwards movement, or trend, and starts consolidating, or takes a pause. Whenever the price action takes a pause, that is when it is considered a pole pattern.
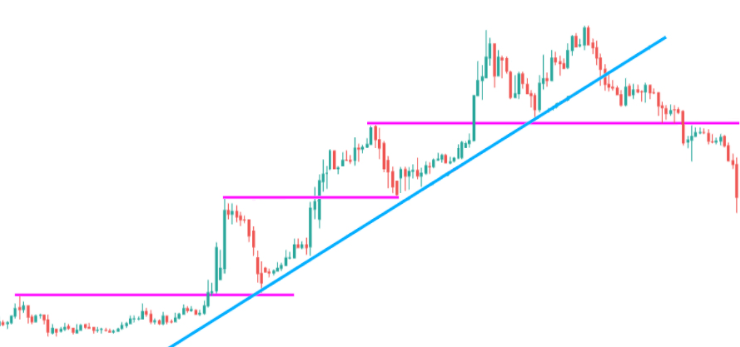
Bullish Channel or Range Pattern – Bullish channel or range candlestick patterns are patterns that occur in an overall uptrend. These patterns appear as though the price keeps “bouncing” off the same price level without going above or below that level. The more times that the price has touched this level, the more the pattern forms.
Bullish Trend – Bullish trend candlestick patterns are patterns where the price seems to just “keep going up”. The price will take very small pauses throughout the entire move, however, it will keep continuing in that direction. All bullish aspects of technical analysis are very strong in these patterns.
Bearish Candlestick Patterns
Bearish Pole Pattern – Bearish pole patterns are commonly known as “Bear Flags” and “Bear Pennants” but are the same exact concept so they are grouped as “Bear Pole” patterns. These patters occur after a strong downwards movement, or trend, and starts consolidating, or takes a pause. Whenever the price action takes a pause, that is when it is considered a pole pattern.
Bearish Channel or Range Pattern – Bearish channel or range candlestick patterns are patterns that occur in an overall downtrend. These patterns appear as though the price keeps “bouncing” off the same price level without going above or below that level. The more times that the price has touched this level, the more the pattern forms.
Bearish Trend – Bearish trend candlestick patterns are patterns where the price seems to just “keep going down”. The price will take very small pauses throughout the entire move, however, it will keep continuing in that direction. All bearish aspects of technical analysis are very strong in these patterns.
Neutral Candlestick Patterns
Neutral Channel or Range Pattern – Neutral channel or range candlestick patterns are patterns that occur in no trend. These patterns appear as though the price keeps “bouncing” off the same price level without going above or below that level. The more times that the price has touched this level, the more the pattern forms. The price overall is going “sideways” in this pattern.
More In-Depth
Candlestick Psychology
Candlestick psychology is key to any day trader or investor. Candlesticks and candlestick patterns reveal the overall market sentiment, the raw emotions and decisions of every single market participant.
By looking at the different candlesticks and candlestick patterns day traders and investors can see the strength of a trend, potential reversals and make informed decisions in the stock market.
This technical tool is a must have for price prediction and trading strategies. In the financial markets mastering candlestick psychology will improve your investing and trading results and is a must have for anyone who wants to succeed in stocks and fundamentals.
Candlestick Buying and Selling Pressure
When it comes to every candlestick you see on the chart, the wicks provide a lot more information than you might think. For example: the bigger the LOWER WICK on a bullish hammer candle, you can be more sure there is a lot of buying pressure at that price level.
Selling pressure is the exact same concept as buying pressure, the only difference is the price is now selling instead of buying. For example: the bigger the UPPER WICK on a bearish hammer candle, you can be more sure there is a lot of selling pressure at that price level.
Important Signs To Look For
Volume
Volume is the amount of shares, or contracts, that asset bought and sold in a specific time frame previously set by the day trader or investor. Volume is a very important indicator you need to look out for with analyzing candlesticks and candlestick patterns.
The more volume that occurs on a specific candlestick or candlestick pattern, the more confident you can be in the overall move, or the level of support or resistance will hold.
For example: the volume was the same across the last 10 candlesticks, a hammer candlestick then forms with double the amount of volume that the last 10 candlesticks had. You can be very confident in this hammer candle.
Volume is a very important technical indicator that you must watch out for in your day trading and investing.
Consolidation
Consolidation, or a brief pause, in the price typically occurs in an overall uptrend or downtrend. Consolidation can be a good thing when it comes to identifying pole patterns and taking advantage of them, however, they can also be an indicator of a potential reversal.
Consolidation, when it comes to psychology, means that the price action doesn’t really know where to continue next. It is crucial that you look out for consolidation points, and potentially even take profits off the table incase of a reversal.
Fake-outs
Fake-outs are when the price action does everything that it is “supposed” to do and yet it fails. Most of the time, these fake-outs occur after a “rejection” in an overall downtrend or “bounce” in an overall uptrend.
Fake-outs are important to look out for as they mess with your psychology and can cause frustration. It is important to stay calm during these fake-outs because there are no guarantees in the stock market and nothing is 100%.
Fake-outs are also very important to keep an eye on because they suggest that the price is still going to continue in the same direction it was previously going. It is important to watch out for these and to be patient to trade them as it is riskier.
Like Us? Follow Us!
Pages
Follow us
Leave a Reply
You must be logged in to post a comment.