Day Trading Strategies: How to Build and Execute Winning Trades

Click Here to Save Time
Time Saver
Technical analysis uses historical price data to predict future stock movements, providing valuable insights for traders.
Identifying support and resistance levels helps traders make informed buy and sell decisions, optimizing their investments.
Understanding different trading styles like day trading and swing trading is crucial for crafting effective strategies.
Implementing proper risk management techniques, such as stop-loss and take-profit levels, is essential for protecting capital.
Real-world case studies demonstrate successful application of technical analysis tools in the stock market.
Combining technical analysis with fundamental analysis can create a balanced approach to investing in financial markets.
Introduction
Developing a comprehensive technical analysis strategy allows day traders and investors to better navigate the complexities of the financial market, optimizing their performance and reducing risks.
In the fascinating world of day trading and investing, the art of technical analysis stands out as a powerful tool that empowers investors and traders to make informed decisions based on patterns and data, rather than just gut feelings or untested theories.
A day trading strategy, however, might be just as important as technical analysis as a whole and every trader should have one.
This article will delve into the key concepts of technical analysis, offering practical examples and real-world case studies to demonstrate how traders can effectively apply these principles to enhance their trading strategies.
Key Concepts in Technical Analysis
In technical analysis, several key concepts play a crucial role in shaping trading strategies.
Let’s explore these concepts, which form the foundation of successful technical analysis.
Price Action and Chart Patterns

Price action refers to the movement of an asset’s price over time.
It revolves around the study of historical prices, which are depicted on charts, and serves as the basis for identifying patterns and trends.
Candlestick chart patterns, in particular, are vital tools in technical analysis, offering visual representations of price action that can indicate potential trend continuations or reversals.
– Head and Shoulders Pattern:
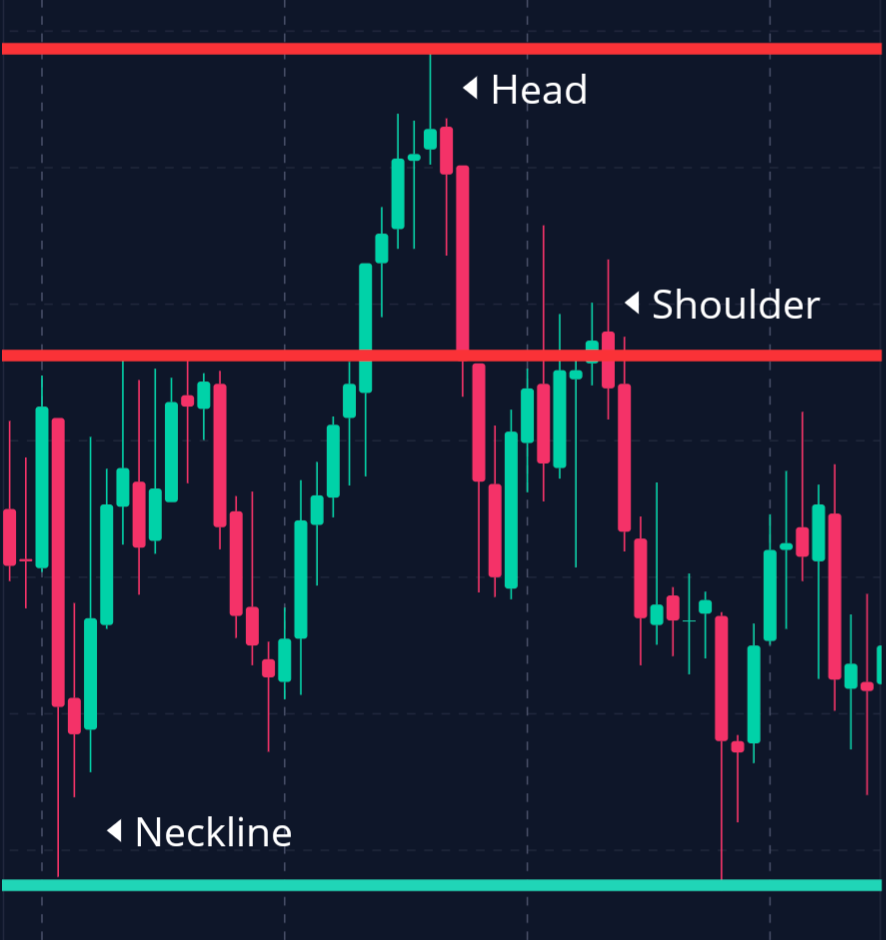
This classic reversal pattern consists of three peaks: a higher middle peak (head) flanked by two lower peaks (shoulders).
The neckline, drawn below the peaks, acts as a critical support level.
A break below this line signals a bearish reversal, prompting traders to consider short positions.
– Double Tops and Bottoms:
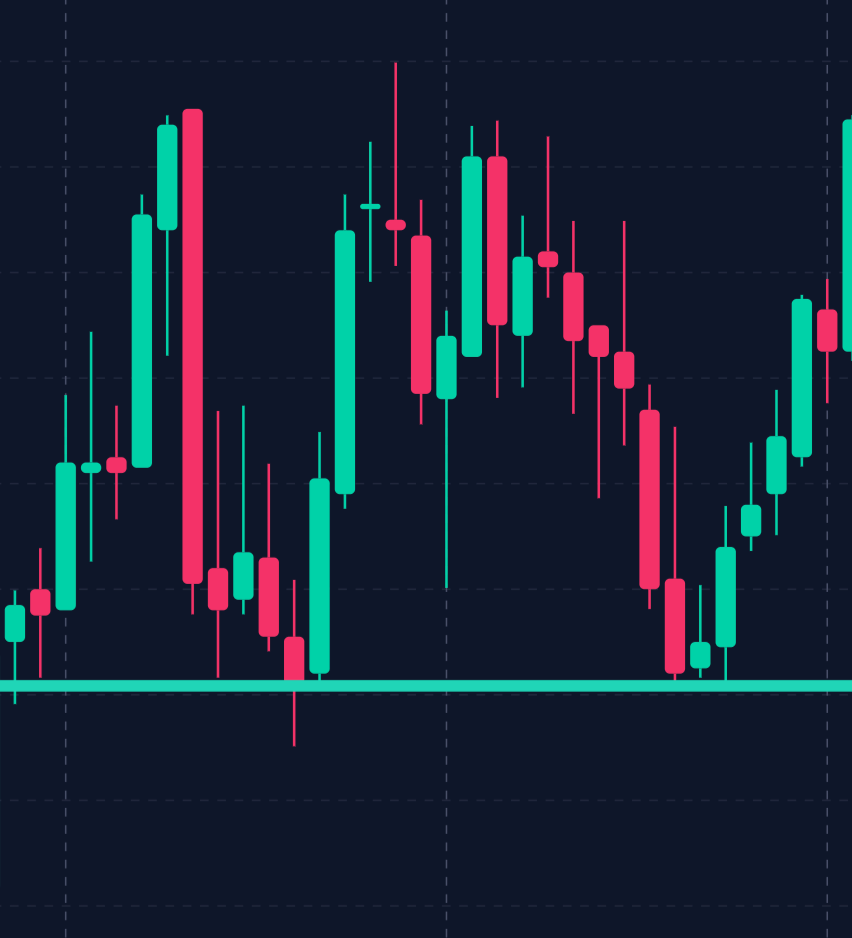
These reversal patterns suggest a change in trend direction.
A double top occurs when a stock reaches a resistance level twice before reversing downward, while a double bottom occurs when a stock reaches a support level twice before reversing upward.
– Triangles:
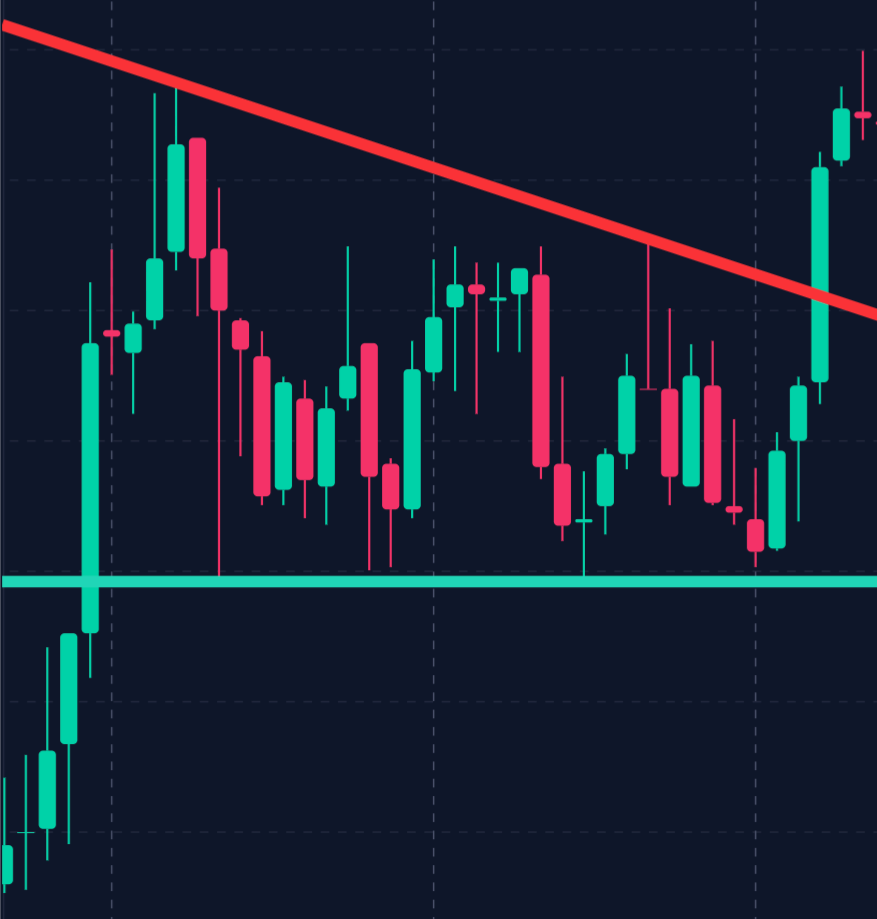
Triangles can be ascending, descending, or symmetrical, representing consolidation phases where the price narrows before a breakout occurs.
Example:
In early 2023, Apple Inc. (AAPL) exhibited a symmetrical triangle pattern, a common sight for seasoned traders.
This pattern indicated a consolidation phase, with traders closely monitoring the breakout point to determine the next move.
When the price broke out upward, it presented a perfect opportunity for traders to enter long positions and ride the bullish wave.
Support and Resistance Levels
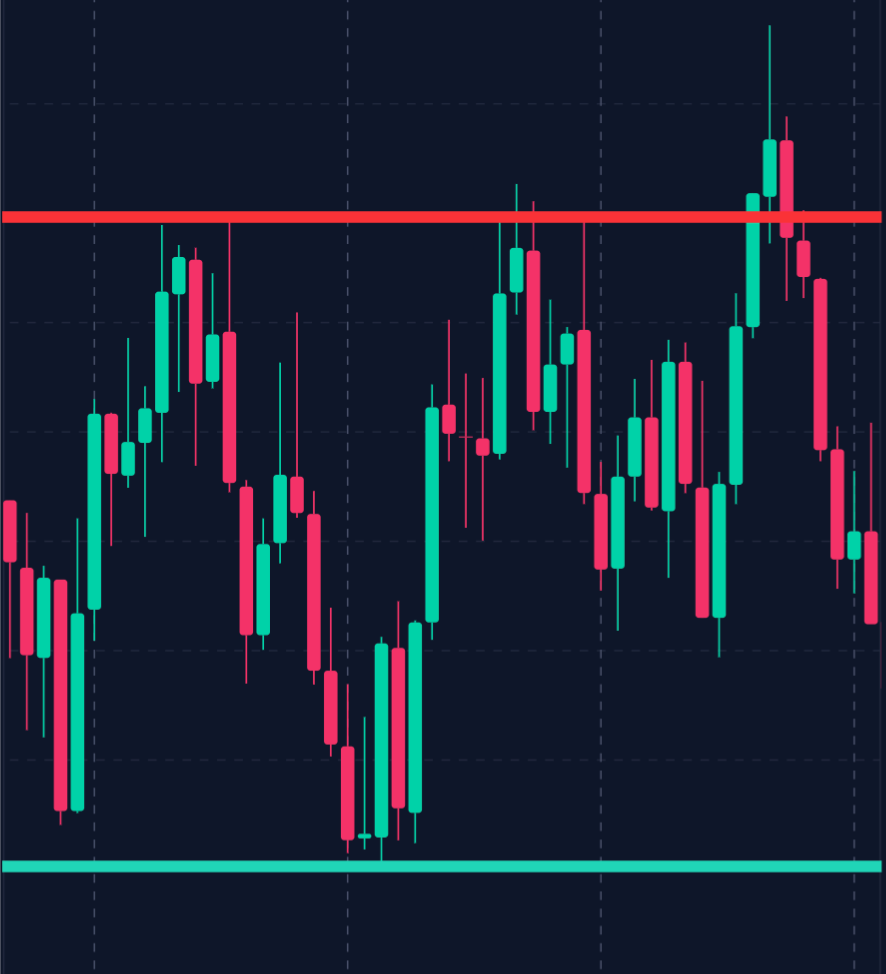
Support and resistance levels are fundamental concepts in technical analysis, providing crucial information about market sentiment and potential price movement.
Support refers to a price level where buying interest is strong enough to prevent the price from falling further.
On the other hand, resistance is a price level where selling interest is strong enough to prevent the price from rising further.
– Support Level Example:

Suppose a stock consistently bounces back after reaching $50; this price acts as a support level, indicating a strong buying interest at this point.
– Resistance Level Example:
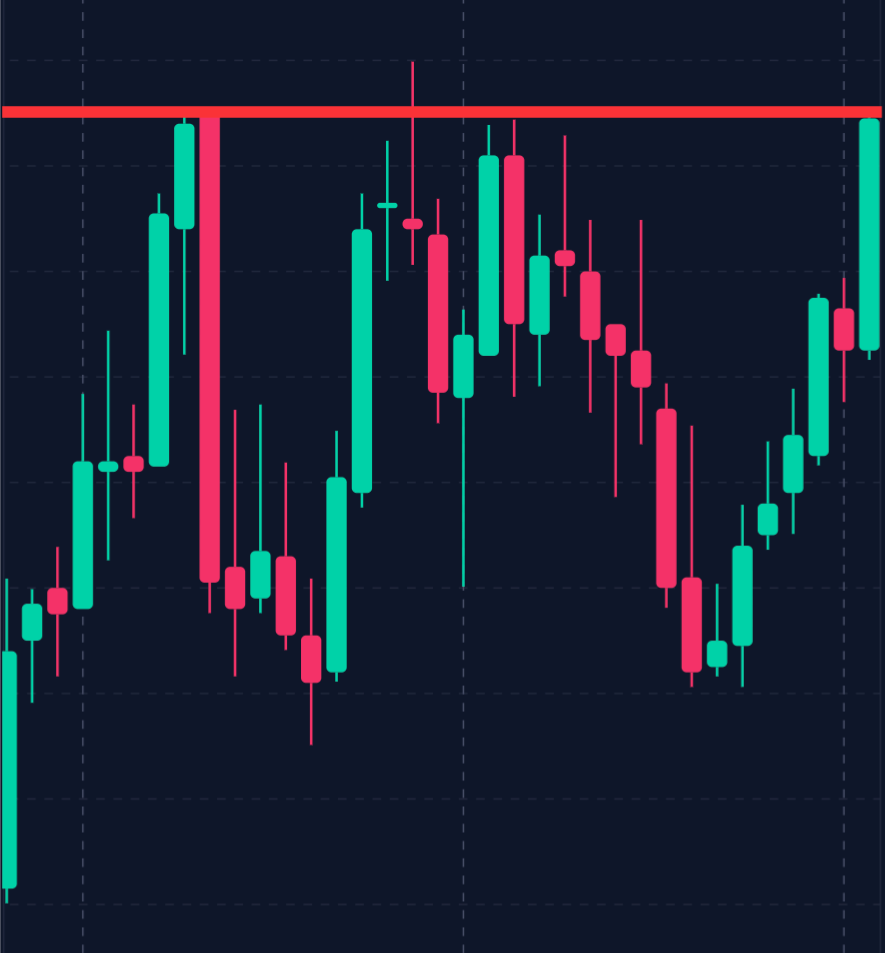
If a stock struggles to break above $100 consistently, this price serves as a resistance level, suggesting a strong selling interest at this point.
Traders use support and resistance levels to identify potential entry and exit points. Buying near support levels and selling near resistance levels can be a practical strategy for range-bound markets, allowing traders to capitalize on predictable price movements.
Trend Lines and Channels
Trend lines and channels are another essential tool in technical analysis that help day traders and investors visualize and identify the direction of a trend.
A trend line is a straight line drawn on a chart to connect consecutive highs or lows, indicating the general direction of price movement.
– Uptrend Example:
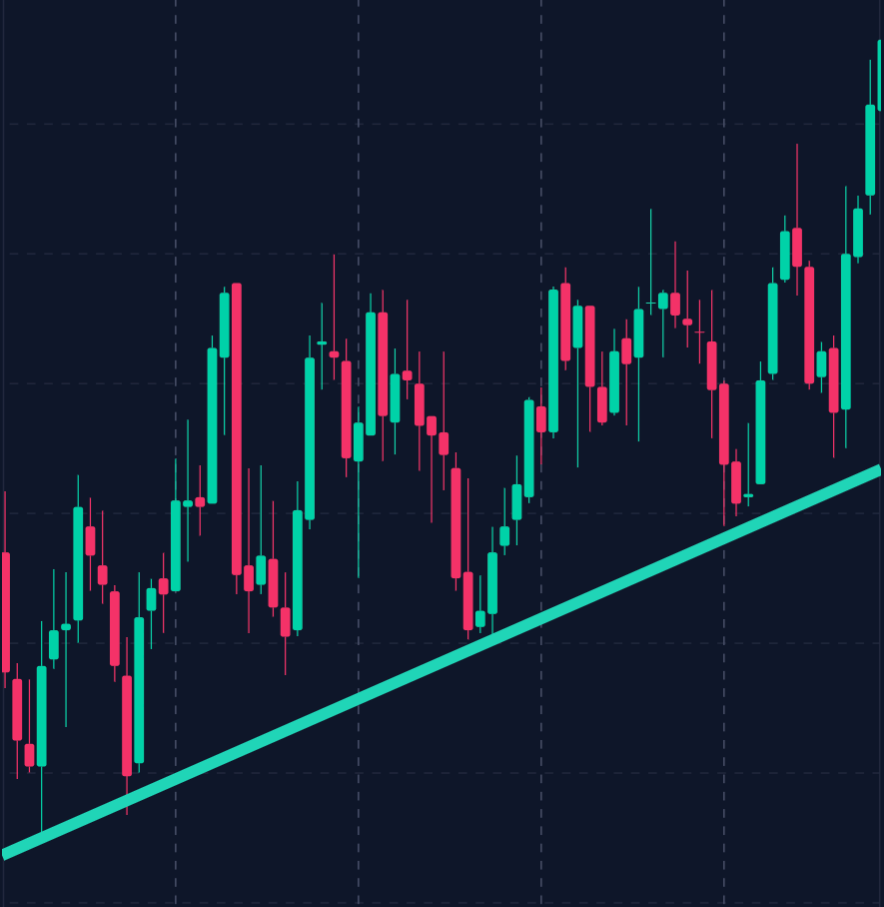
An upward trend line connects a series of higher lows, suggesting a bullish market sentiment.
Traders can use this trend line as a dynamic support level, entering long positions when the price approaches the line.
– Downtrend Example:
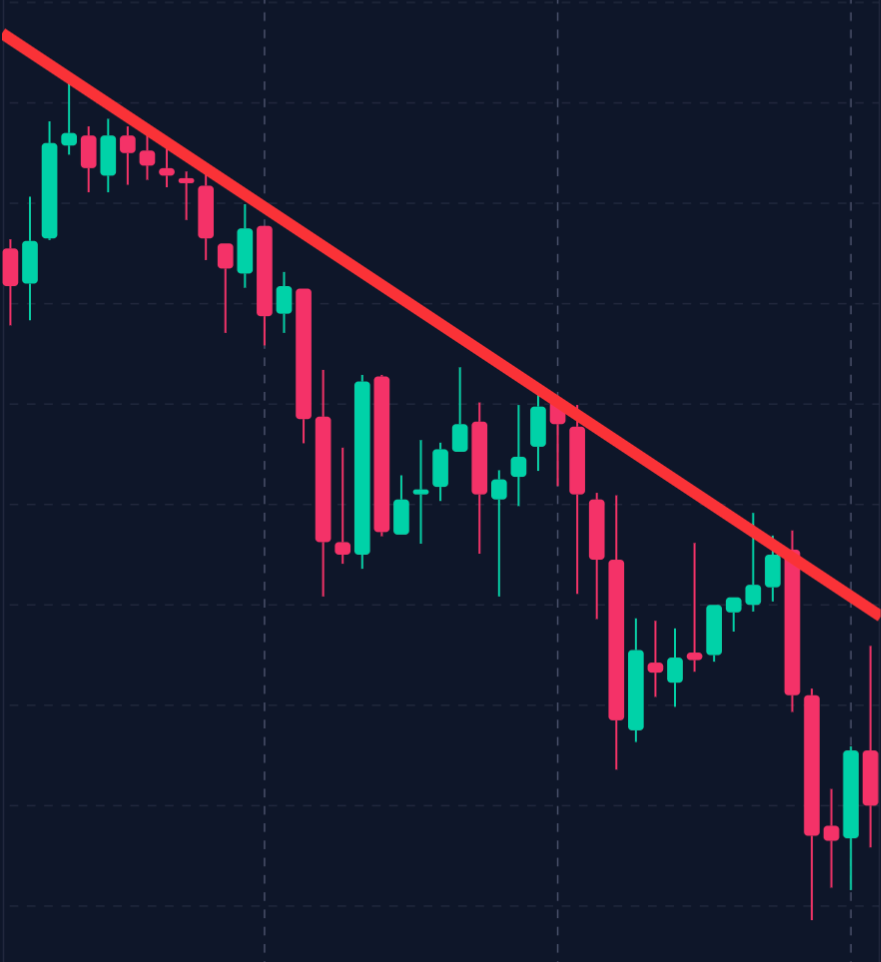
A downward trend line connects a series of lower highs, signaling a bearish market sentiment.
Traders can use this trend line as a dynamic resistance level, entering short positions when the price approaches the line.
Channels, on the other hand, are formed by drawing parallel lines at the peaks and troughs of a trend.

Channels provide a more comprehensive view of the trend, allowing traders to identify potential reversal points and plan their trades accordingly.
Indicators and Oscillators
Indicators and oscillators are technical indicators, derived from difficult math calculations, that are based on the price and volume data, providing day traders with valuable insights into market conditions.
These tools can confirm trends, indicate momentum, and predict potential reversals, enhancing traders’ decision-making processes.
– Moving Averages (MA):
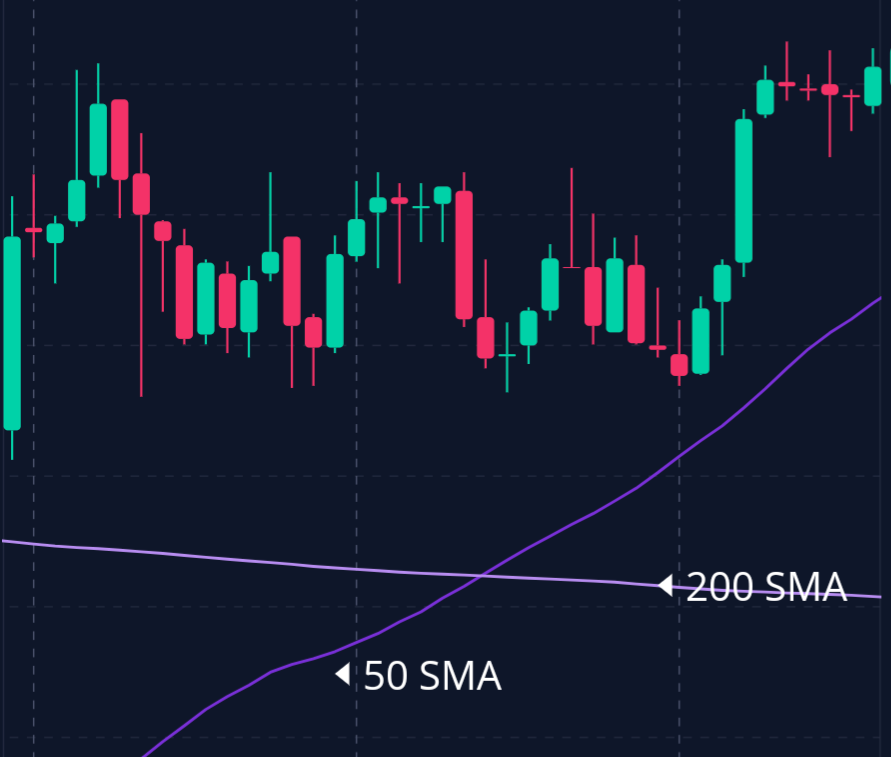
Moving averages smooth out price data to identify trends over specific time frames.
The two most common types are the simple moving average (SMA) and the exponential moving average (EMA).
Day traders and investors, both, often use moving average crossovers as buy or sell signals, entering positions based on the crossover’s direction.
– Relative Strength Index (RSI):

RSI is an oscillator that measures the speed and change of price movements.
It ranges from 0 to 100 and is typically used to identify overbought or oversold conditions.
An RSI above 70 indicates overbought conditions, while an RSI below 30 indicates oversold conditions.
– Moving Average Convergence Divergence (MACD):

MACD is a trend-following momentum indicator that shows the relationship between two moving averages.
Traders look for MACD line crossovers and divergences from the price action to signal potential buy or sell opportunities.
Example:
In late 2022, Tesla, Inc. (TSLA) experienced a dip in its RSI below 30, indicating oversold conditions.
This signal alerted day traders to a potential buying opportunity, anticipating a price rebound that materialized shortly after.
Developing a Technical Analysis Strategy
Crafting a robust technical analysis strategy requires a structured approach and an understanding of various market dynamics.
Whether you’re a beginner investor or an experienced day trader, developing a strategy tailored to your goals and trading style is mandatory.
Let’s dive into the essential steps to build an effective technical analysis strategy.
Setting Objectives and Goals

The foundation of any successful trading strategy is setting clear and achievable objectives.
By defining your trading goals, you can help shape your approach and align your actions with your financial ambitions.
Here are some potential objectives or goals you should consider:
– Short-Term Profit Generation: Perfect for day traders looking to make quick profits by capitalizing on minute-to-minute price changes.
– Long-Term Investment Growth: Suitable for swing traders or those with a more extended horizon who aim to benefit from broader market trends.
– Capital Preservation and Risk Management: Essential for those who prioritize safeguarding their investments over chasing high returns.
Example Objective:
Suppose a trader sets a goal to achieve a 10% return on their investment portfolio within six months while ensuring no single trade results in a loss exceeding 2% of their total capital.
This clear objective will guide their trading decisions and risk management tactics.
By defining precise goals, you set a clear path for your trading strategy, allowing for better decision-making and discipline in the financial markets.
Identifying Trading Styles
Every trader has a unique approach, often dictated by their trading style.
Understanding your trading style is crucial, as it influences the choice of tools, indicators, and time frames you’ll employ.
Here’s a breakdown of common trading styles:
1. Scalping:
A fast-paced style where traders capitalize on tiny price movements, holding positions for seconds or minutes.
Scalpers use very short time frames, often less than 5 minutes, and rely heavily on technical indicators for quick decision-making.
2. Day Trading:
Involves buying and selling financial instruments within the same day.
Day traders aim to profit from intraday price fluctuations, requiring real-time data analysis and quick reflexes.
3. Swing Trading: Focuses on capturing price swings over several days or even weeks.
Swing traders use a combination of technical analysis, fundamental analysis, and market sentiment to identify potential entry and exit points.
4. Position Trading:
A long-term approach where traders hold positions for weeks, months, or even years.
Position traders rely on longer time frames and fundamental analysis to identify market trends.
Case Study:
Day Trading with Momentum Indicators
Consider a day trader specializing in tech stocks.
This trader uses momentum indicators, such as the RSI and MACD, to spot potential entry points.
During a volatile session, the RSI dips below 30, signaling oversold conditions. The trader enters a long position, capitalizing on the subsequent price rebound.
Time Frames and Chart Analysis

Selecting appropriate time frames and charts is absolutely vital for achieving effective technical analysis.
The time frame you choose should align with your trading style and goals:
– Intraday Charts (1-minute, 2-minute, 5-minute):
Best suited for scalping and day trading, where quick decisions are critical.
– Short-Term Charts (15-minute, 30-minute, 1-hour):
Ideal for swing traders who seek to capture price movements over several days.
– Medium to Long-Term Charts (daily, weekly, monthly):
Suitable for position traders focusing on long-term trends.
Using multiple time frames can provide a comprehensive view of market trends.
For instance, a day trader might analyze a 5-minute chart for entry points while keeping an eye on a 1-hour chart for broader trend confirmation.
Example:
Multi-Time Frame Analysis
A trader might use a daily chart to identify the overall trend direction (bullish or bearish) and then zoom in on an hourly chart to pinpoint specific entry and exit points.
This multi-time frame approach allows for more informed trading decisions, allowing for maximum profit potential.
Selecting the Right Indicators
Indicators are vital tools that provide insights into market trends, momentum, and potential reversals.
Choosing the right indicators depends on your trading strategy, goals, and personal situation:
1. Trend Indicators:
Moving averages (SMA, EMA) and MACD help identify the direction and strength of a trend.
Traders use these indicators to confirm trend continuation or reversal points.
2. Momentum Indicators:
RSI and Stochastic Oscillator measure the speúed of price changes, indicating potential overbought or oversold conditions.
These indicators can signal when a trend is losing momentum and a reversal might be imminent.
3. Volume Indicators:
On-Balance Volume (OBV) and Volume Weighted Average Price (VWAP) provide insights into trading volume and its impact on price.
High volume can indicate strong interest in a security, potentially signaling trend continuation.
4. Volatility Indicators:
Bollinger Bands and Average True Range (ATR) measure market volatility, helping traders assess potential price breakouts or consolidation phases.
Example:
Combining Indicators for a Comprehensive Strategy
A trader might use the MACD to identify trends, RSI to gauge momentum, and Bollinger Bands to assess volatility.
This combination provides a well-rounded view of market conditions, allowing for more precise entry and exit decisions.
Risk Management in Technical Analysis

Risk management is a cornerstone of successful trading, essential for protecting capital and ensuring long-term success.
Let’s explore key risk management techniques that should be part of any technical analysis strategy.
Importance of Risk Management
Effective risk management is about more than just avoiding losses; it’s about strategically managing potential downsides to preserve capital and enable growth.
Key components include:
– Stop-Loss Orders:
Automatically closing a position at a predetermined price to limit losses if the market moves against you.
– Take-Profit Orders:
Setting a target price where a position is automatically closed to secure profits when the market moves in your favor.
– Position Sizing:
Determining how much capital to allocate to each trade based on your risk tolerance and account size.
– Risk-Reward Ratios:
Ensuring potential profits outweigh potential losses by maintaining a favorable risk-reward ratio, such as 1:3 (risking $1 to gain $3).
Example:
Implementing a Stop-Loss Strategy
A trader enters a position at $100, setting a stop-loss at $95 to limit potential losses to 5%.
They also set a take-profit order at $115, ensuring a favorable risk-reward ratio.
By managing risks, the trader protects their investment and aligns their strategy with their financial goals.
Stop-Loss and Take-Profit Levels
Stop-loss and take-profit levels are very important tools for managing trades and protecting your capital:
– Stop-Loss Orders:
These are crucial for minimizing potential losses.
For example, if a stock’s support level is $50, a trader might set a stop-loss slightly below this level to protect against unexpected downward movements.
– Take-Profit Orders:
These help secure gains when the market moves in your favor.
If a stock approaches a resistance level of $70, a trader might set a take-profit just below this level to lock in profits before the price reverses.
Example:
Stop-Loss and Take-Profit Implementation
Consider a trader who buys a stock at $100, sets a stop-loss at $98, and a take-profit at $110.
This setup ensures they limit potential losses while maximizing potential gains, creating a balanced approach to risk management.
Position Sizing and Risk-Reward Ratios
Position sizing determines how much of your capital is allocated to each trade.
It’s a critical component of risk management, ensuring you don’t overexpose your portfolio to any single trade.
1. Calculating Position Size:
Consider your risk tolerance, account size, and stop-loss distance.
For example, if you risk 2% ($1,000) of a $50,000 account with a $5 stop-loss, you’d buy 200 shares.
2. Risk-Reward Ratios:
Evaluate the potential profit versus the risk involved.
A favorable risk-reward ratio increases your chances of long-term success.
Example:
Position Sizing for a Conservative Trader
A conservative trader with a $100,000 account risks 1% ($1,000) per trade.
If their stop-loss is $10 per share, they buy 100 shares, ensuring the risk is controlled and aligned with their risk tolerance.
Case Studies of Successful Technical Analysis Strategies
Understanding technical analysis concepts through real-world examples can illustrate how traders apply these principles to achieve success in the financial market.
Here are two case studies that demonstrate the effective use of technical analysis tools and strategies.
Case Studies
Case Study 1: Using Moving Averages in a Trending Market
Company: Amazon Inc. (AMZN)
Time Frame: January 2023 – June 2023
Trading Style: Swing Trading
Background
In early 2023, Amazon’s stock price displayed signs of entering a sustained uptrend.
Swing traders, who aim to profit from medium-term price movements, focused on moving averages to guide their trading decisions during this period.
Strategy
1. Indicators Used:
– 50-day Simple Moving Average (SMA): This indicator helps identify the medium-term trend.
– 200-day Simple Moving Average (SMA): This indicator is used to determine the long-term trend.
2. Analysis:
– Golden Cross: In January 2023, Amazon’s 50-day SMA crossed above the 200-day SMA, creating a “Golden Cross.”
This pattern is a well-regarded bullish signal that suggests the potential for an extended upward trend.
3. Entry Point:
– Swing traders entered long positions when the Golden Cross was confirmed, approximately at the $95 mark, anticipating continued bullish momentum.
4. Risk Management:
– A stop-loss order was placed just below the 200-day SMA at $90, minimizing potential losses if the trend reversed unexpectedly.
5. Exit Strategy:
– Traders watched for key resistance levels, such as previous highs around $110, to determine exit points, maximizing profits before potential reversals.
Outcome
The strategy was successful, with Amazon’s stock price rising steadily, reaching a peak of approximately $115 by June 2023.
Swing traders who leveraged this technical analysis approach enjoyed significant gains by aligning their positions with the established uptrend and carefully managing risk.
Analysis
This case study shows how moving averages can be used effectively to identify trends and guide trading decisions.
By recognizing a Golden Cross pattern, traders captured profits by entering positions in alignment with the prevailing market trend.
Case Study 2: Identifying Reversals with RSI Divergence
Company: Microsoft Corporation (MSFT)
Time Frame: March 2023 – May 2023
Trading Style: Day Trading
Background
Microsoft’s stock exhibited volatility and frequent price swings during the spring of 2023.
Day traders, who focus on short-term opportunities, aimed to identify potential reversals using the Relative Strength Index (RSI).
Strategy
1. Indicators Used:
– Relative Strength Index (RSI): This momentum oscillator helps measure the speed and change of price movements, signaling overbought or oversold conditions.
2. Analysis:
– RSI Divergence: In mid-March, Microsoft’s stock price made new highs, but the RSI showed lower highs, indicating a bearish divergence.
This divergence suggested weakening momentum, pointing to a potential price reversal.
3. Entry Point:
– Traders entered short positions when the RSI divergence was confirmed, around the $290 level, expecting a pullback in the stock price.
4. Risk Management:
– Stop-loss orders were placed above the recent highs at $295, limiting potential losses if the reversal didn’t occur.
5. Exit Strategy:
– Traders targeted a support zone around $275 for taking profits, where buying interest was likely to re-emerge.
Outcome
The RSI divergence accurately predicted a short-term reversal, as Microsoft’s stock price declined to $275 by late April.
Day traders who applied this strategy successfully captured quick profits by exploiting the momentum shift.
Analysis
This case study highlights the effectiveness of using RSI divergence to identify potential reversals in the market.
By combining the RSI indicator with price action analysis, traders anticipated short-term shifts in momentum and executed profitable trades.
Common Pitfalls in Day Trading

While technical analysis offers significant advantages, day traders and investors must be cautious of common pitfalls that can undermine their strategies.
Being aware of these psychological challenges and implementing solutions can improve the effectiveness of your technical analysis approach.
Over-Reliance on Indicators
Pitfall:
Traders sometimes depend too heavily on technical indicators, using them as standalone signals without considering other market factors.
This over-reliance can lead to missed opportunities and losses if the indicators fail to accurately predict price movements.
Solution:
Use indicators as part of a comprehensive analysis that includes chart patterns, support and resistance levels, and market fundamentals.
This approach of not relying on indicators alone ensures a well-rounded view of market conditions.
Ignoring Market News and Fundamentals
Pitfall:
Technical analysis focuses on historical price data and patterns, sometimes leading traders to overlook important news events or fundamental changes that can significantly impact stock market dynamics.
Solution:
Stay informed about economic indicators, earnings reports, geopolitical events, and other relevant news that can affect market sentiment.
Combining technical analysis with fundamental analysis provides a balanced and informed approach to investing.
Example:
Balancing Technical and Fundamental Analysis
Imagine a trader who identifies a bullish technical pattern but is aware of an upcoming earnings report.
They might wait for the report before entering a position, ensuring they don’t overlook potential fundamental shifts that could impact the stock price.
Emotional Trading and Its Consequences
Pitfall:
Emotional reactions, such as fear and greed, often lead traders to make impulsive decisions that deviate from their strategy.
This emotional trading can result in poor trade execution and increased risk.
Solution:
Develop a trading plan with clear entry and exit criteria, risk management rules, and discipline to stick to your strategy.
Automated trading tools or alerts can help minimize emotional bias.
Example:
Automating Alerts to Manage Emotions
A trader sets automated alerts for when a stock reaches specific price levels, ensuring they enter or exit positions based on predetermined criteria rather than emotional reactions to market volatility.
Chasing Trends Without Confirmation
Pitfall:
Traders may rush into trends without waiting for proper confirmation, leading to false signals and potential losses.
Jumping on a trend too early or without sufficient evidence can result in unfavorable trades.
Solution:
Use multiple indicators or chart patterns to confirm trends before entering positions.
Waiting for confirmation, such as a breakout or pullback, can reduce the risk of false signals and improve trading accuracy.
Example:
Confirming Trends with Multiple Indicators
Before entering a trade based on a perceived trend, a trader might look for confirmation through a combination of moving averages, RSI, and support/resistance levels, ensuring the trend is robust and reliable.
Tools and Platforms for Technical Analysis
In today’s digital trading environment, various tools and platforms use technical analysis by offering advanced charting capabilities, real-time data, and customizable indicators.
Here are some of the most popular charting platforms and how they can be integrated into your technical analysis strategy.
Popular Charting Software
1. TradingView:
– Features:
TradingView offers a user-friendly interface, a wide range of technical indicators, and community-driven insights.
It is highly customizable and allows users to collaborate and share trading ideas.
– Ideal For:
Beginners and experienced traders looking for a collaborative and intuitive charting platform.
2. MetaTrader 4/5 (MT4/MT5):
– Features:
MetaTrader provides advanced charting tools, algorithmic trading capabilities, and access to a vast array of technical indicators.
It supports automated trading strategies, making it a favorite among forex traders.
– Ideal For:
Forex traders and those interested in developing automated trading strategies.
3. Thinkorswim by TD Ameritrade:
– Features:
Thinkorswim offers comprehensive technical analysis tools, customizable charts, and access to various asset classes, including stocks, options, and futures.
– Ideal For:
Traders seeking an all-in-one platform with robust educational resources and analytical capabilities.
4. NinjaTrader:
– Features:
NinjaTrader provides advanced charting, strategy development, and market analysis tools.
It supports automated trading and is known for its powerful scripting capabilities.
– Ideal For:
Futures and forex traders looking for robust technical analysis features and customization options.
Integrating Technical Analysis Tools
Integrating technical analysis tools into your trading routine can enhance your ability to identify trends, patterns, and potential opportunities.
Here are some tips for effective integration:
– Custom Indicators:
Develop or customize indicators to suit your specific trading style and strategy.
This allows you to tailor your analysis to your unique needs and preferences.
– Backtesting:
Use historical data to test your strategies and evaluate their effectiveness before applying them in real-time trading.
Backtesting helps identify potential weaknesses and optimize your approach.
– Alerts and Notifications:
Set up alerts for key price levels, indicator crossovers, or other significant market events to ensure timely decision-making.
This keeps you informed and ready to act when opportunities arise.
Example:
Using Alerts for Quick Decision-Making
A trader uses TradingView to set alerts for when a stock’s RSI crosses a specific threshold, enabling them to act swiftly and make informed decisions based on real-time data.
Backtest Strategies
Backtesting is a crucial step in developing and refining technical analysis strategies.
It involves testing a strategy using historical data to assess its performance under different market conditions.
Here’s how to conduct effective backtesting:
1. Define Your Strategy:
Clearly outline the rules and criteria for your trading strategy, including entry and exit points, risk management, and indicators used.
A well-defined strategy provides a structured approach to testing.
2. Select Historical Data:
Choose a relevant time period and market conditions that reflect your trading style and objectives.
This ensures the backtesting results are applicable to your intended strategy.
3. Evaluate Performance:
Analyze the results, focusing on key metrics such as win rate, risk-reward ratio, drawdown, and overall profitability.
This analysis provides insights into the strategy’s effectiveness and areas for improvement.
4. Refine and Optimize:
Based on the results, refine your strategy by adjusting parameters or incorporating additional indicators to enhance performance.
Continuous refinement ensures your strategy adapts to changing market conditions.
Example:
Backtesting a Moving Average Crossover Strategy
A day trader or investor develops a moving average crossover strategy using a 50-day and a 200-day simple moving average.
By backtesting this strategy on historical data for the S&P 500 index, the trader assesses its effectiveness in identifying trends and generating profits over time.
The backtest reveals a favorable risk-reward ratio, prompting the trader to optimize entry and exit points for even better results.
Conclusion
Developing a comprehensive technical analysis strategy requires a blend of knowledge, discipline, and adaptability.
By understanding key concepts like chart patterns, support and resistance levels, and technical indicators, day traders and investors can craft strategies that align with their unique goals and trading styles.
The successful application of technical analysis can enhance decision-making, optimize risk management, and improve trading outcomes in the financial markets.
As the stock market evolves, so should your technical analysis strategy. Continuous learning and adaptation are essential to staying ahead of market trends and identifying opportunities.
By integrating technical analysis with fundamental insights and leveraging advanced tools and platforms, traders can navigate the complexities of the stock market with confidence and precision.
Click Here For Our Sources
Sources
1. Investopedia – Technical Analysis:
https://www.investopedia.com/terms/t/technicalanalysis.asp
2. TradingView – Charting Platform:
3. MetaTrader 4/5 – Trading Platform:
4. Thinkorswim – Trading Platform by TD Ameritrade:
https://www.tdameritrade.com/tools-and-platforms/thinkorswim.page
5. NinjaTrader – Trading Platform:
6. Trading Psychology – Managing Emotions:
https://www.investopedia.com/articles/trading/06/tradingpsychology.asp
7. Backtesting
Leave a Reply
You must be logged in to post a comment.