Advanced Technical Analysis Mastery: Skills and Techniques You MUST Know

Click Here To Save Time
Time Saver
Advanced chart patterns like Head and Shoulders help predict market movements.
Indicators like RSI and MACD offer valuable signals for buy/sell decisions.
Analyzing trading volume can confirm trends and signal potential reversals.
These techniques identify support and resistance levels, aiding market predictions.
Automated trading strategies enhance speed and precision in execution.
Staying updated with new tools and trends is vital for successful trading.
Introduction
Advanced technical analysis is a way day traders and investors look at market activity to predict future price changes.
It’s all about understanding patterns and using tools to decide when to buy or sell stocks, currencies, or other financial instruments.
For beginners, this might mean recognizing simple patterns and using basic indicators. But for those who want to go deeper, advanced technical analysis offers a range of powerful techniques that provide more detailed insights.
Why Advanced Technical Analysis is Important
Advanced technical analysis helps day traders and investors make even better decisions by providing more detailed information about market trends.
It’s like having a magnifying glass that lets you see the finer details of market movements.
This article will explore various advanced techniques that can help traders enhance their strategies and improve their trading results.
Understanding Market Trends and Patterns
Market trends and patterns are the backbone of advanced technical analysis.
Recognizing these trends is essential for predicting where the market is heading.
Let’s dive into some of the more advanced chart patterns and how they can be used.
Advanced Chart Patterns
1. Head and Shoulders
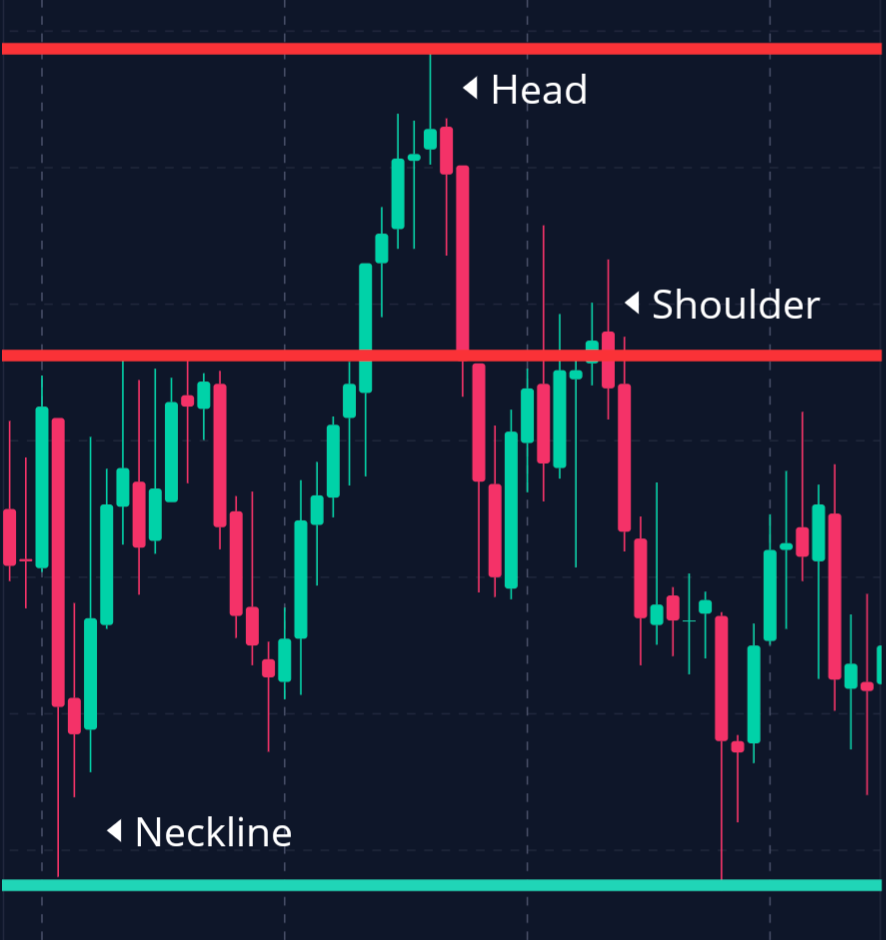
The Head and Shoulders pattern is a famous chart pattern that signals a change in trend.
It’s made up of three peaks: the head, which is the highest, and two shoulders that are slightly lower.
This pattern can show when a trend is likely to reverse from bullish (going up) to bearish (going down).
Example:
– Formation:
Imagine the market is going up. First, you see a small peak (left shoulder), then a bigger peak (head), and finally another small peak (right shoulder).
– Analysis:
When the price drops below the support level on the two shoulders, it often signals that prices will fall further.
2. Double Tops and Bottoms
These patterns are easy to recognize and can indicate that the market is ready to change direction.
A Double Top suggests that prices will go down, while a Double Bottom indicates they might go up.
Example:
– Double Top:
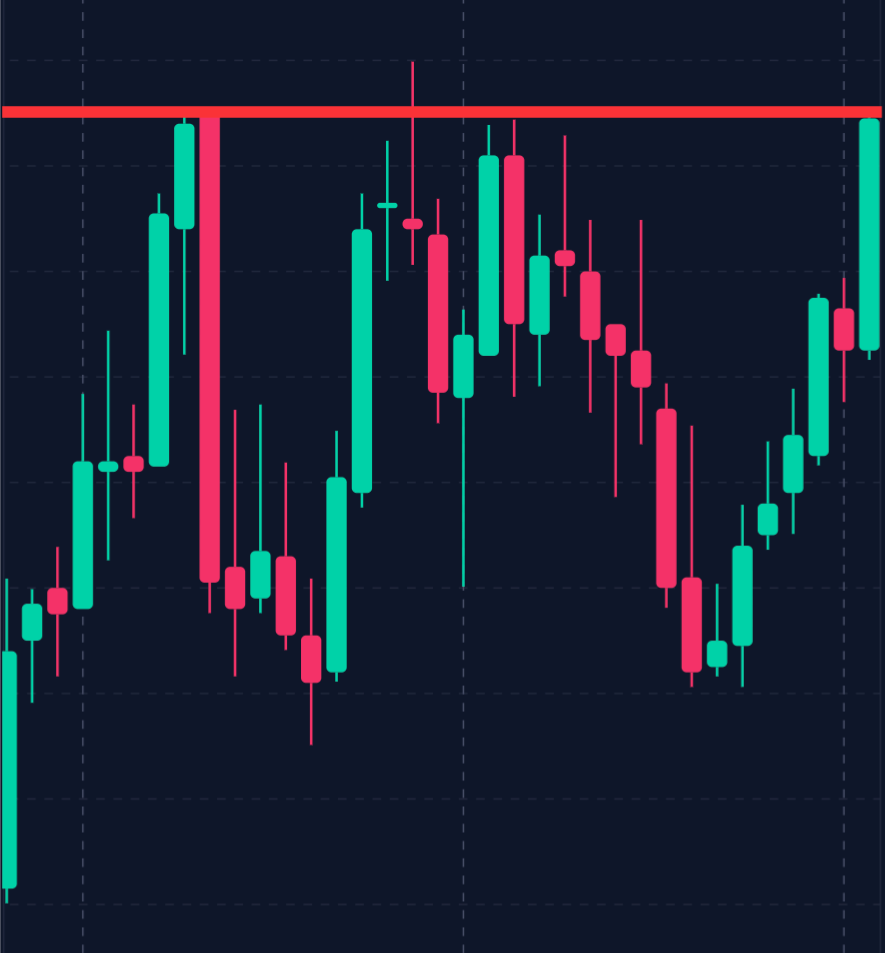
The price peaks twice at about the same level, separated by a dip. If the price falls below the dip, it’s likely to keep dropping.
– Double Bottom:
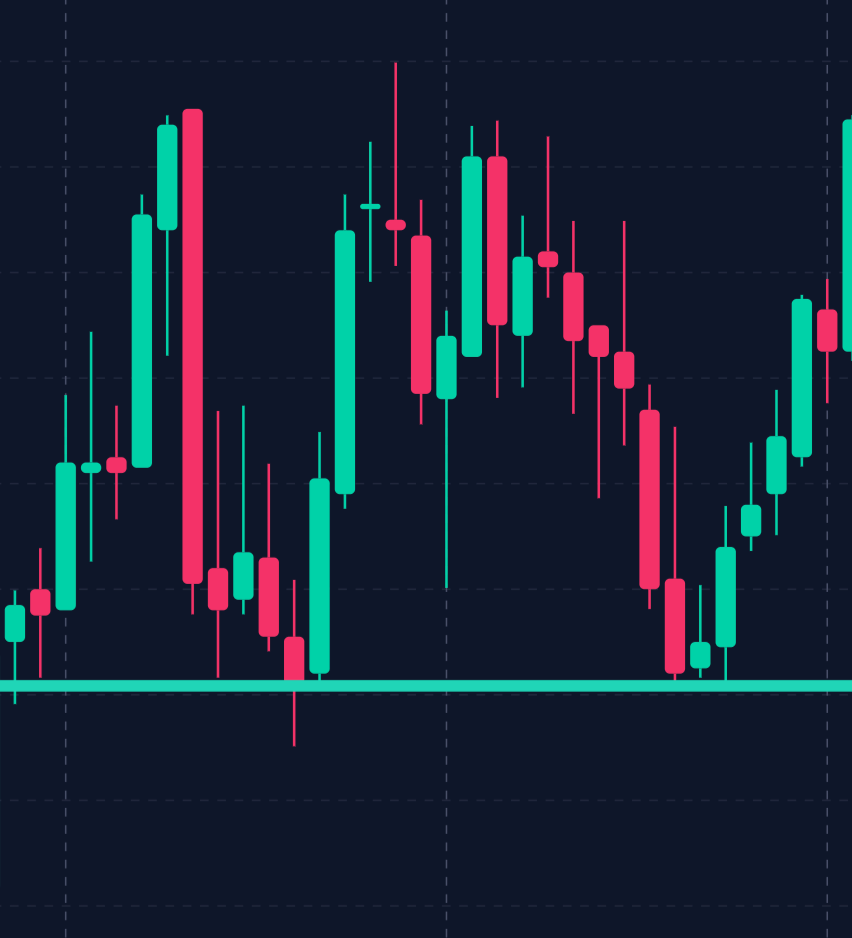
The price hits a low twice. When it rises above the high between the two lows, prices are likely to keep rising.
Trend Analysis Techniques
Knowing how strong a trend is and when it might change is crucial.
– Trendlines and Channels:
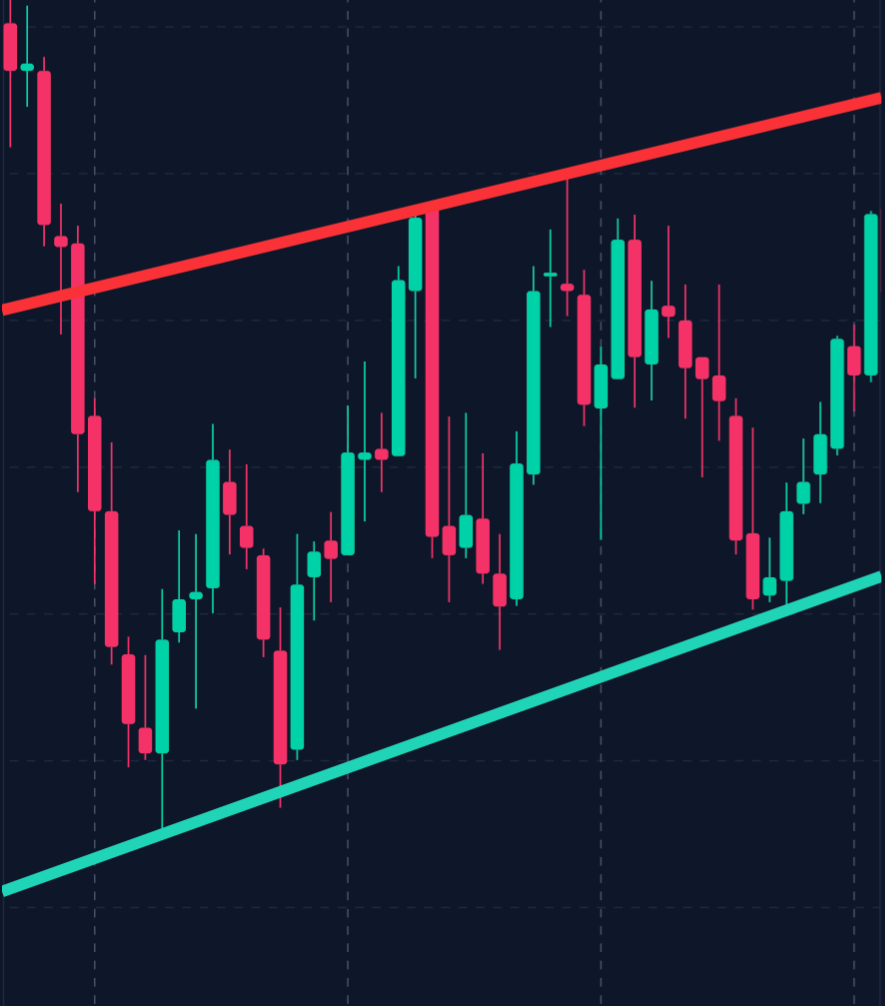
Drawing lines on a chart to connect highs or lows helps spot trends and potential reversal points.
– Trend Strength Indicators:
:max_bytes(150000):strip_icc():format(webp)/dotdash_Final_ADX_The_Trend_Strength_Indicator_Sep_2020-04-87ebd2ddb8ab43a2904176247fd620ed.jpg)
Tools like the Average Directional Index (ADX) tell you how strong a trend is, helping you avoid making trades based on weak trends.
Example:
Analyzing Trend Reversals
Consider a situation where you see a Double Top pattern on a stock chart.
The stock has been rising, but the Double Top hints it might soon fall.
You can confirm this by checking other indicators, like volume and the ADX, which shows the trend’s weakening strength.
Analysis:
– Volume Confirmation:
A drop in trading volume during the second peak can confirm the pattern.
– ADX Analysis:
A lower ADX value suggests the uptrend is losing strength, supporting the idea of a reversal.
Conclusion:
Understanding advanced chart patterns and trends can help you make informed trading decisions.
They allow you to anticipate changes and potentially profit from these moves.
Technical Indicators and Oscillators
Technical indicators are mathematical calculations that day traders and investors use to analyze stock charts and predict future price movements.
Advanced techniques make these indicators even more powerful than they already are.
Moving Averages
Moving averages help smooth out price data, making trends easier to spot.
1. Simple Moving Average (SMA):
The SMA is the average price over a set time.
It’s good for spotting long-term trends but might lag in fast-moving markets.
2. Exponential Moving Average (EMA):
The EMA gives more weight to recent prices, making it more responsive to price changes.
This is helpful for short-term analysis and in volatile markets.
Example:
– Crossovers:
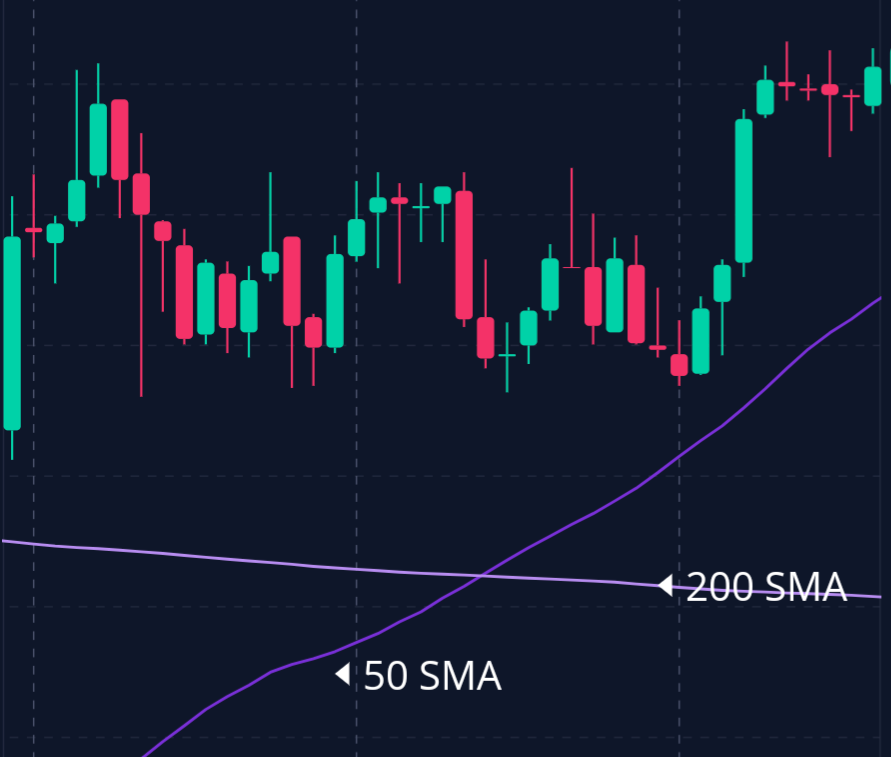
Day traders often use two EMAs (like a 50-day and 200-day) to signal trends.
When a shorter EMA crosses above a longer one, it suggests an uptrend.
Relative Strength Index (RSI) and Its Advanced Uses
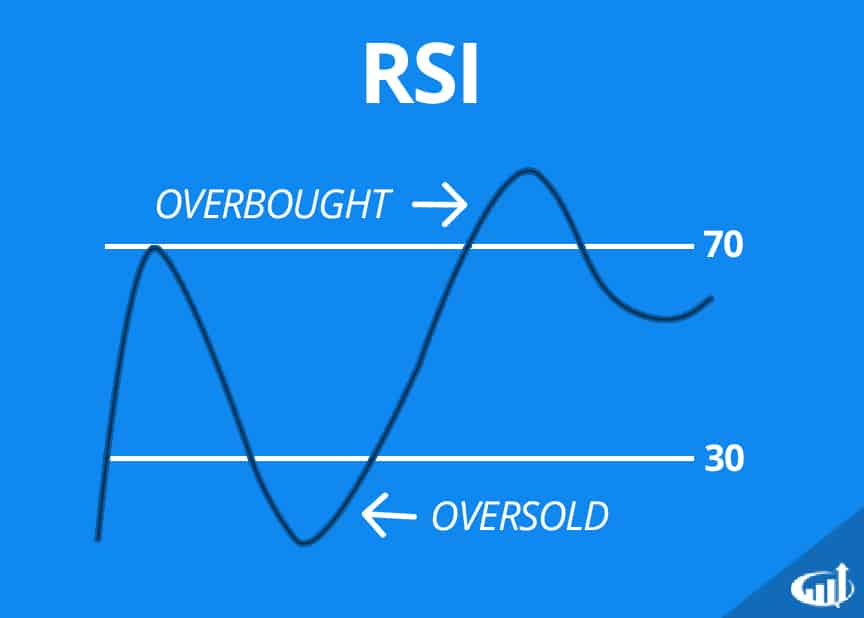
The RSI measures how fast and how much prices change and it ranges from 0 to 100.
A reading above 70 means a stock is overbought, while below 30 suggests it’s oversold.
Advanced Application:
Divergence Analysis
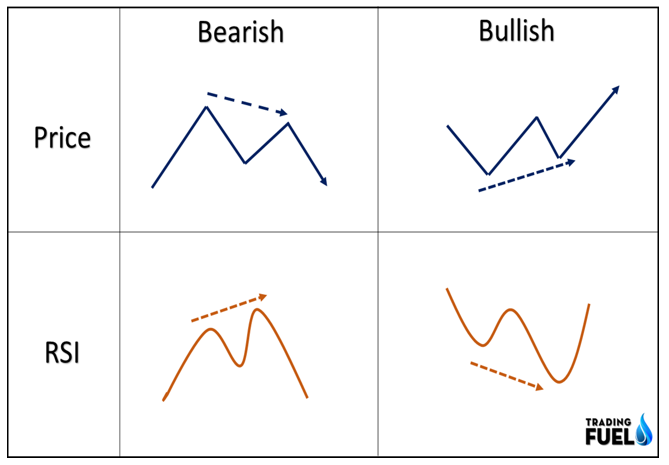
– Bullish Divergence:
When the price makes a lower low but the RSI makes a higher low, it signals weakening downward momentum and a potential upward reversal.
– Bearish Divergence:
When the price makes a higher high but the RSI makes a lower high. This can indicate a potential downward reversal.
Using MACD for Trend Confirmation
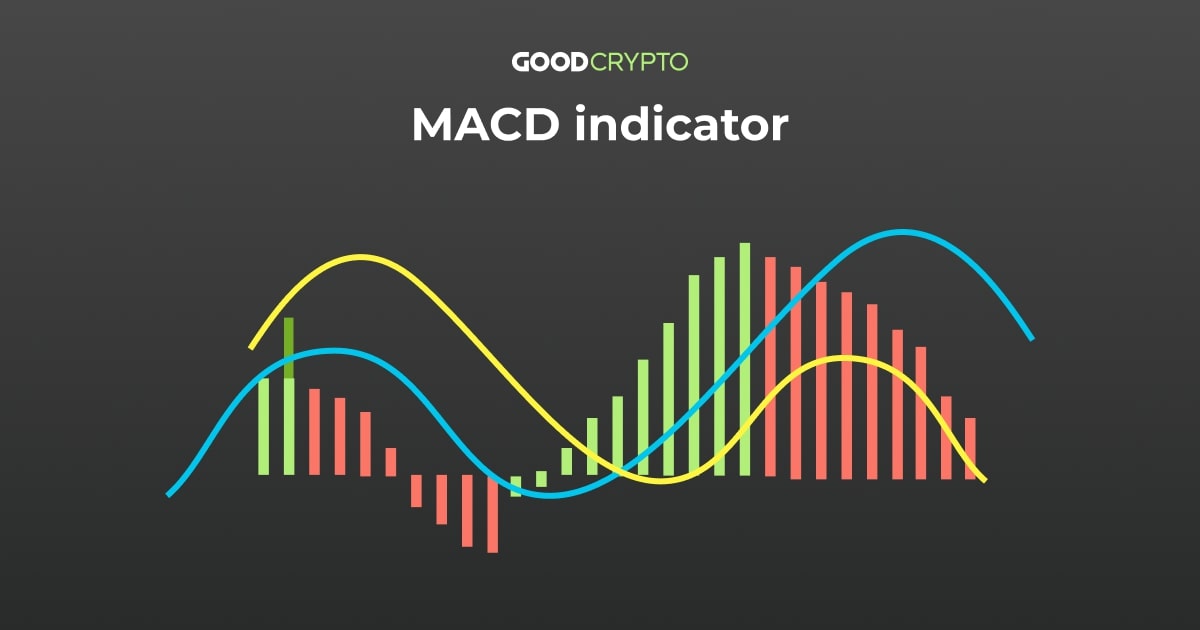
MACD is a popular tool that shows the relationship between two EMAs and it’s
great for spotting changes in trend strength and direction.
Case Study:
– Scenario:
You’re analyzing a stock in a sideways market. The MACD line crosses above the signal line, hinting at an upward trend.
– Confirmation:
Check the RSI for oversold conditions and volume for increased buying interest to confirm the trend.
Outcome:
The combined indicators give a strong buy signal, leading to a successful trade.
Conclusion:
Advanced technical indicators and oscillators improve trading accuracy by offering more detailed insights.
Understanding these tools helps traders anticipate market moves and optimize their strategies.
Volume Analysis
Volume analysis is about examining trading activity to understand the strength of price movements.
It’s crucial for confirming trends and spotting potential reversals.
Volume Indicators
1. On-Balance Volume (OBV):
OBV is a running total of volume that adds volume on up days and subtracts it on down days.
It helps identify trends by comparing volume flow with price movements.
Example:
If OBV is rising during an uptrend, it confirms strong buying interest.
2. Volume Price Trend (VPT):
VPT combines price and volume to show the strength of price changes.
It adds a proportional volume amount when the price moves up and subtracts it when the price moves down.
Example:
In an uptrend, a rising VPT suggests buying pressure supports the price increase, indicating a healthy trend.
3. Accumulation/Distribution Line (A/D Line):
The A/D Line uses price and volume to show if a stock is being accumulated (bought) or distributed (sold).
It gives insights into supply and demand dynamics.
Example:
An upward-sloping A/D Line in an uptrend indicates accumulation, suggesting the trend is supported by strong buying.
Significance of Volume in Price Movements
Volume helps confirm price movements and trends.
Here’s why it matters:
– Trend Confirmation:
Strong trends often come with increasing volume.
In a bullish trend, rising volume confirms the uptrend, while falling volume may signal a potential reversal.
– Reversal Detection:
Volume spikes can hint at reversals.
A big volume increase at key levels, like support or resistance, may show changing market sentiment.
– Breakout Validation:
Breakouts above resistance or below support are more reliable with high volume.
This suggests strong market participation, likely continuing in the breakout direction.
Example:
– Volume Spikes and Their Implications
Let’s say you see a volume spike as a stock nears a resistance level.
The stock has been in an uptrend, and the sudden surge in volume suggests heightened interest.
Analysis:
– Volume Spike:
This shows many day traders are watching this level, expecting a big move.
– Breakout Confirmation:
The stock breaks above resistance with high volume, confirming the breakout.
Outcome:
The stock continues rising, supported by strong buying interest, leading to a profitable trade.
Conclusion
Volume analysis offers valuable insights into market dynamics, confirming trends and spotting reversals.
By using volume indicators, traders can enhance their understanding of market behavior.
Advanced Fibonacci Techniques
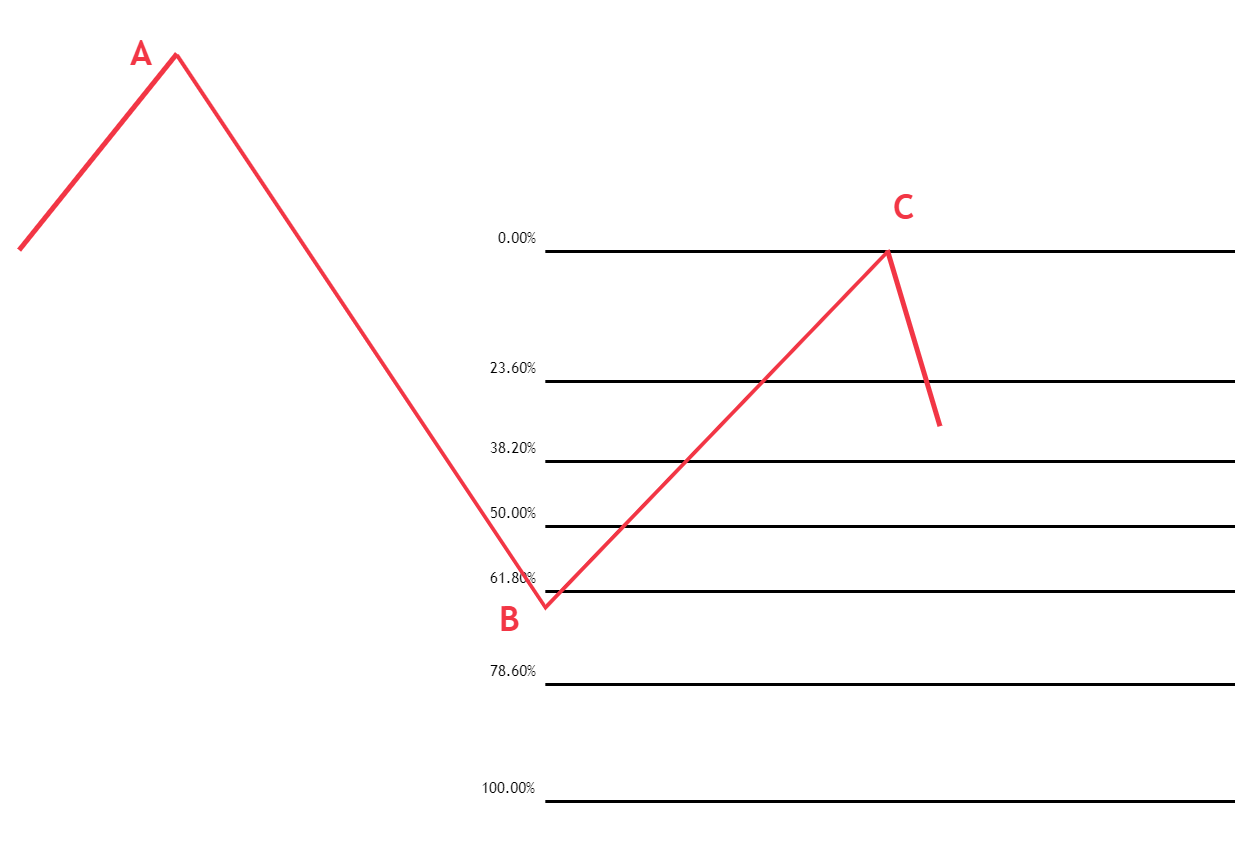
1. Fibonacci Retracements:

Fibonacci retracement levels help traders identify potential support and resistance areas where price movements might reverse or consolidate.
The key retracement levels are 23.6%, 38.2%, 50%, 61.8%, and 78.6%.
These levels are used by both day traders and investors to determine how far a market might pull back from its current trend before continuing in its original direction.
Example:
During an uptrend, a trader may use Fibonacci retracement levels to find where the price could bounce back upwards after a pullback, signaling a good entry point for a long position.
2. Fibonacci Extensions:
Fibonacci extensions help traders identify potential areas where the price might move after a retracement, continuing in the direction of the initial trend.
Key extension levels include 161.8%, 261.8%, and 423.6%.
Example:
In a downtrend, a trader may use Fibonacci extensions to predict where the price could find resistance and potentially reverse, offering a target for taking profits on short positions.
Applying Fibonacci with Other Tools
Combining Fibonacci levels with other advanced technical analysis tools can increase their reliability:
– Trendlines and Support/Resistance:
When Fibonacci levels align with trendlines or previous support/resistance levels, they can provide stronger signals of potential market turning points.
– Candlestick Patterns:
Using Fibonacci levels alongside candlestick patterns can enhance predictions.
For instance, if a bullish candlestick pattern forms at a 61.8% Fibonacci retracement level, it could indicate a strong buy signal.
– Moving Averages:
Aligning Fibonacci levels with moving averages, such as the 50-day or 200-day MA, can help confirm potential reversal points.
Case Study:
Fibonacci Analysis in Forex Trading
Scenario:
A forex trader is analyzing the EUR/USD pair, which has been in a strong downtrend.
The trader uses Fibonacci retracement to identify a potential reversal area.
Analysis:
– Retracement Levels:
The trader notices that the 38.2% retracement level aligns with a previous support level, suggesting it could now act as resistance.
– Confirmation with Other Indicators:
The 50-day EMA is close to the 38.2% level, providing further confirmation that this is a significant area.
– Candlestick Confirmation:
A bearish candlestick pattern forms at this level, reinforcing the potential for a downward continuation.
Outcome:
The price fails to break above the 38.2% retracement level, confirming the trader’s analysis.
The trader enters a short position, capturing the continuation of the downtrend for a profitable trade.
Conclusion
Fibonacci techniques are essential for predicting market movements, offering traders a structured approach to identifying key levels of support and resistance.
By integrating Fibonacci with other advanced technical tools, traders can enhance their ability to forecast market trends and make informed trading decisions.
Candlestick Patterns and Their Applications
Candlestick patterns are visual tools used to interpret market sentiment and potential reversals.
While basic patterns are helpful, advanced patterns provide more specific signals for market entry and exit.
Advanced Candlestick Formations
1. Three Black Crows:
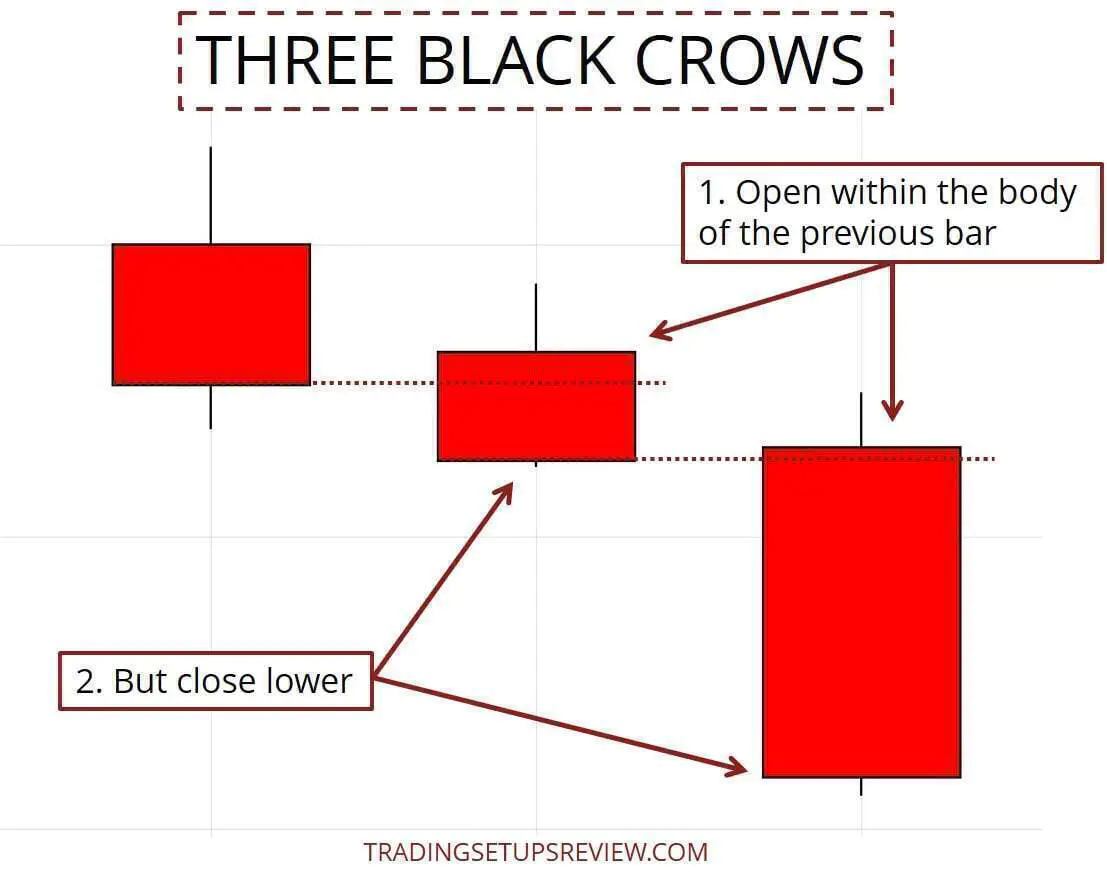
This bearish reversal pattern appears at the end of an uptrend and consists of three consecutive long-bodied bearish candles with small or no shadows.
It indicates strong selling pressure and a likely downward reversal.
Example:
After a strong uptrend, the appearance of three black crows suggests that sellers are gaining control, indicating a potential reversal.
2. Morning Star:
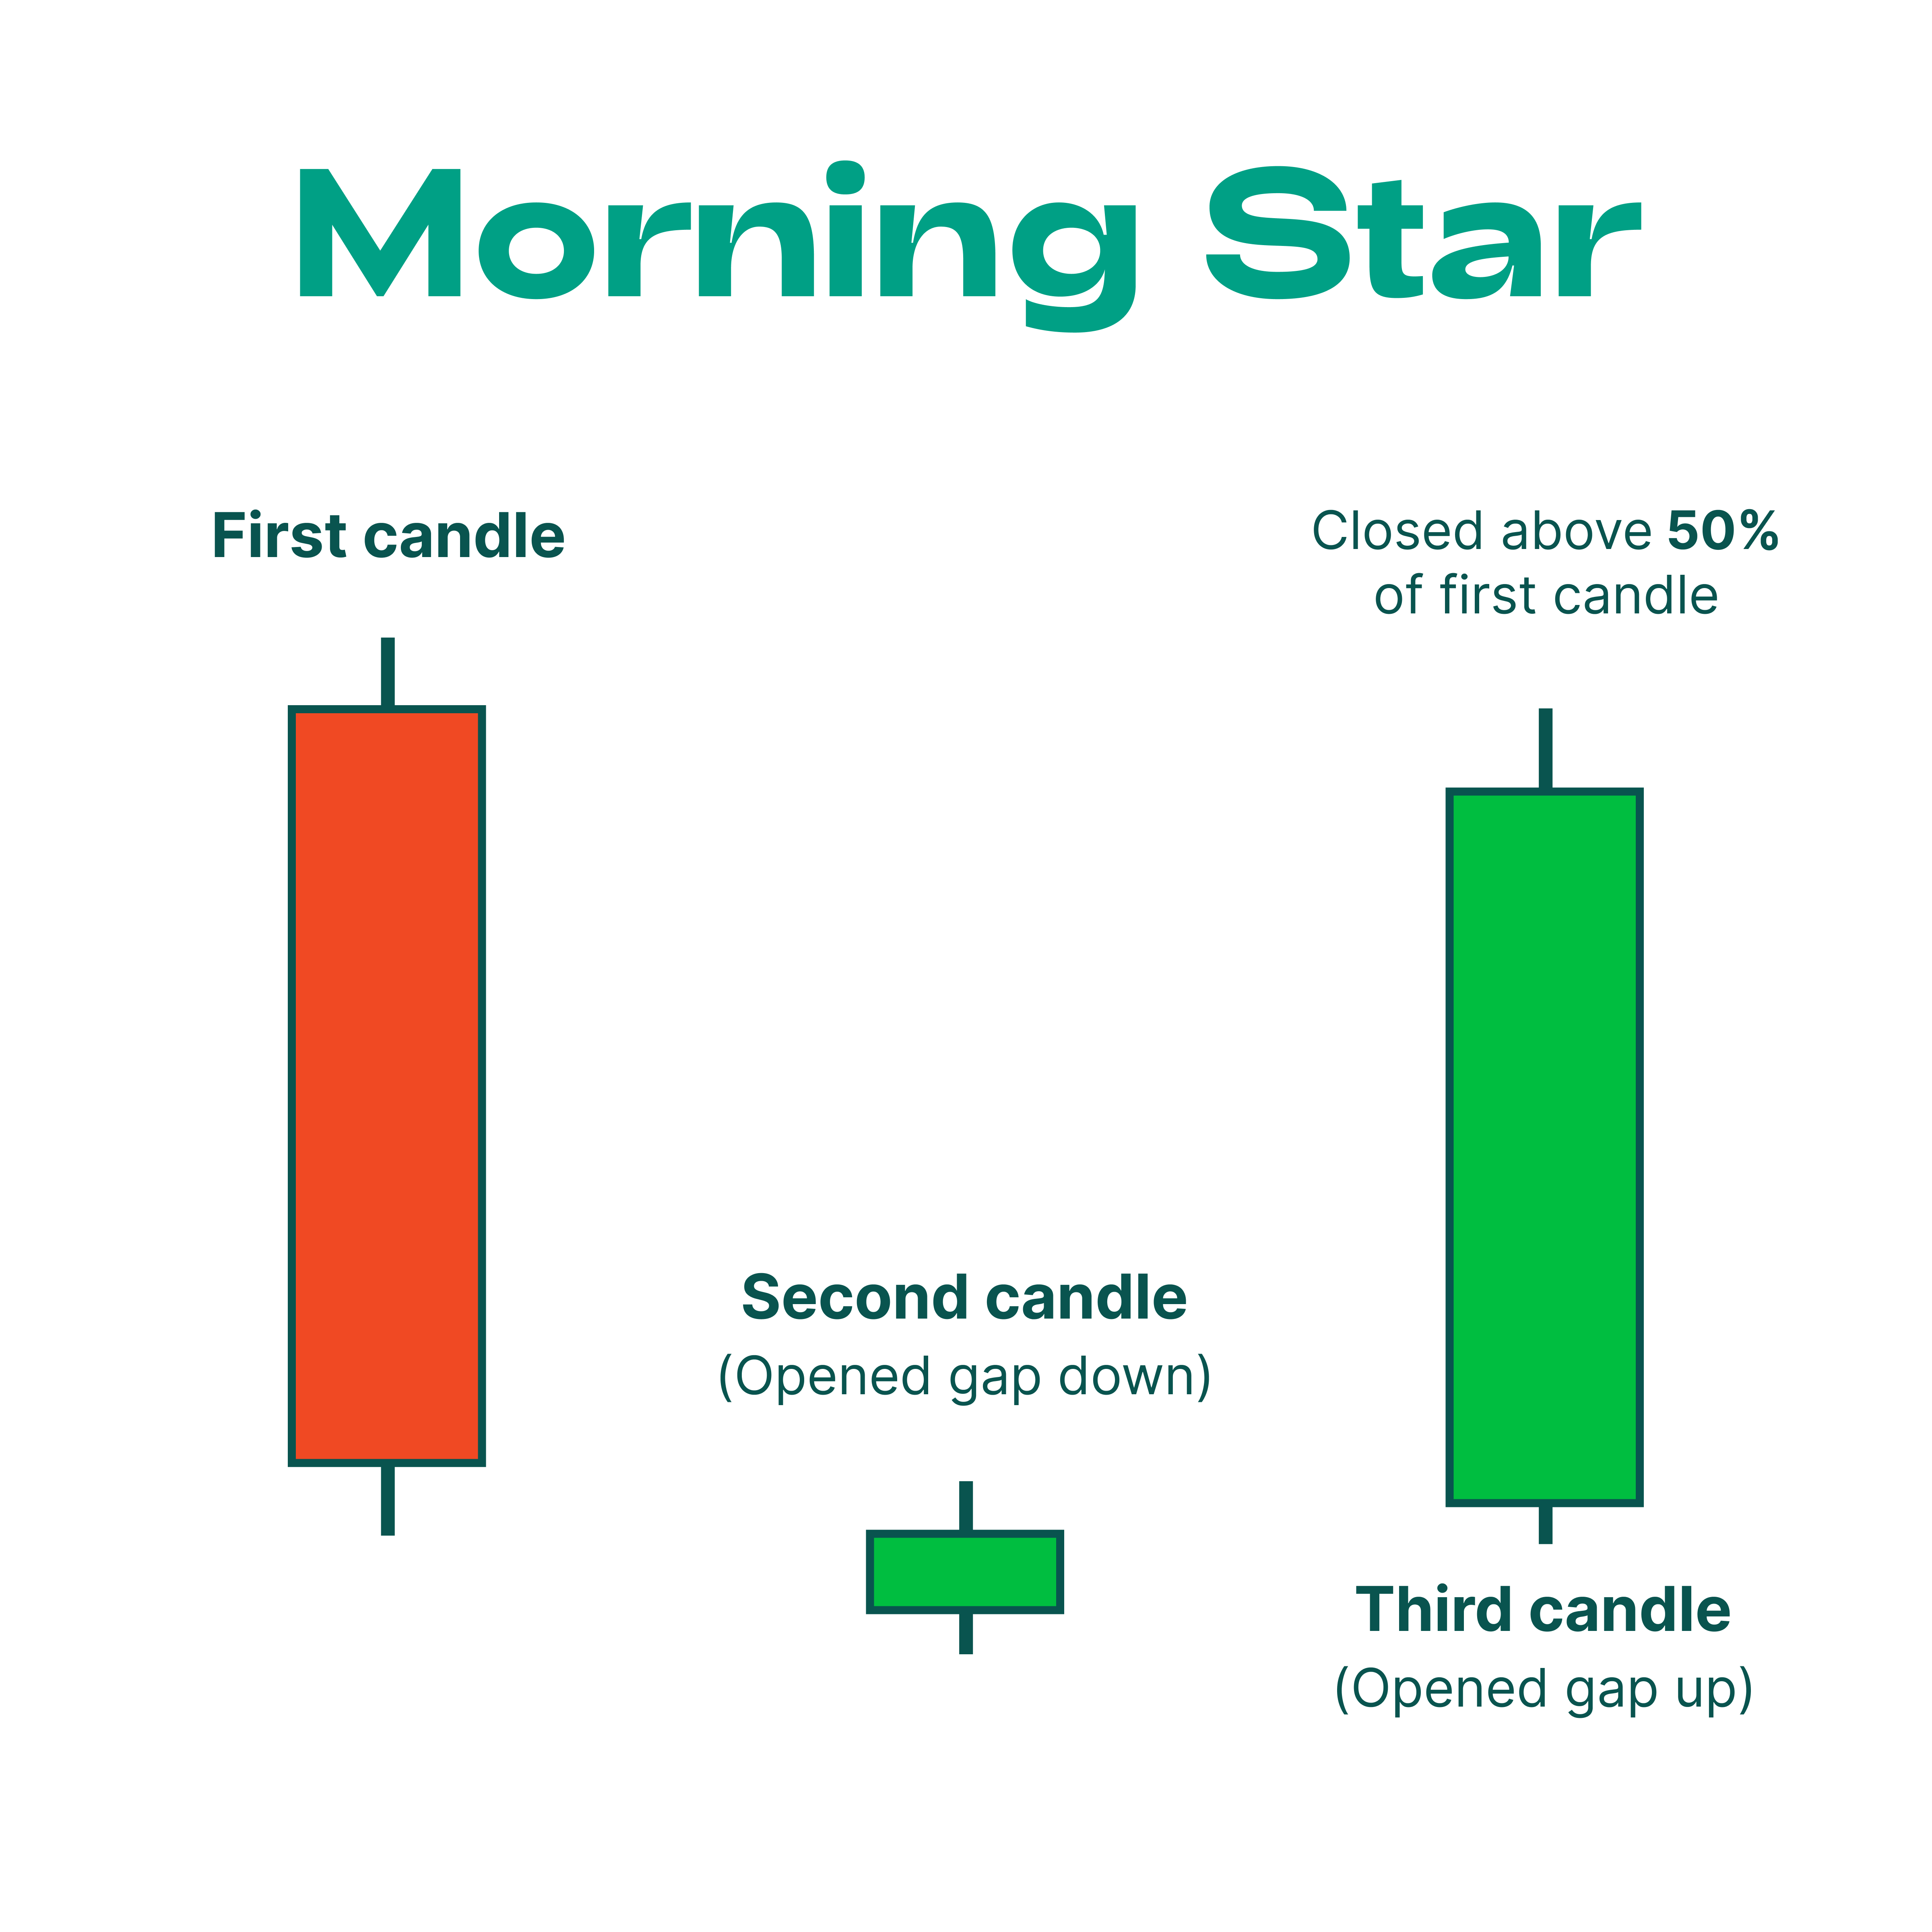
The Morning Star is a bullish reversal pattern found at the bottom of a downtrend.
It includes a long bearish candle, a small-bodied candle (indicating indecision), and a long bullish candle.
Example:
At the end of a downtrend, a Morning Star pattern indicates that buyers are regaining strength, signaling a potential upward reversal.
3. Evening Star:
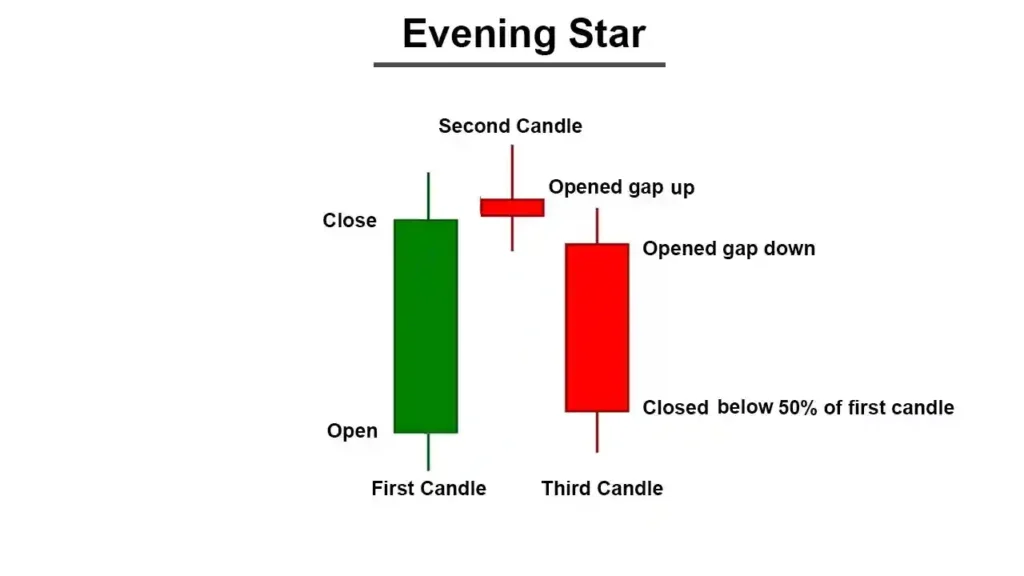
The Evening Star is the bearish counterpart of the Morning Star, appearing at the top of an uptrend.
It consists of a long bullish candle, a small-bodied candle, and a long bearish candle, suggesting a reversal.
Example:
At the peak of an uptrend, the Evening Star pattern indicates weakening buyer momentum and a possible downward reversal.
Integrating Candlestick Analysis with Other Techniques
More advanced day traders often combine candlestick patterns with other analysis tools for more accurate predictions:
– Support and Resistance:
When candlestick patterns form at significant support or resistance levels, they provide stronger reversal signals.
– Volume Analysis:
Analyzing volume alongside candlestick patterns can confirm the strength of a reversal.
For instance, a bullish pattern with high buying volume suggests strong market support.
– Indicators:
Pairing candlestick patterns with indicators like RSI or MACD can provide additional confirmation for trade entries or exits.
Example:
Candlestick Patterns in Volatile Markets
Scenario:
A trader is analyzing a volatile stock and notices a bullish engulfing pattern at a key support level.
Analysis:
– Support Level:
The bullish engulfing pattern forms at a previously tested support level, indicating strong buying interest.
– Volume Confirmation:
The pattern is accompanied by a significant increase in volume, suggesting buyers are stepping in.
– Indicator Alignment:
The RSI shows oversold conditions, providing further confirmation of a potential reversal.
Outcome:
The price rises sharply after forming the bullish engulfing pattern, confirming the trader’s analysis.
The trader enters a long position, capturing the upward move for a successful trade.
Elliott Wave Theory
:max_bytes(150000):strip_icc()/ElliottWaveTheory-3b9e53bcf5964199901554edabe5634f.png)
The Elliott Wave Theory is a technical analysis framework that helps traders forecast market trends by identifying repetitive wave patterns.
Developed by Ralph Nelson Elliott, this theory suggests that market prices move in a series of waves influenced by investor psychology.
Basics of Elliott Wave Theory
Wave Structure
Elliott Wave Theory identifies two main types of waves:
– Impulse Waves:
These move in the direction of the main trend and consist of five waves, labeled 1 through 5.
Impulse waves indicate strong trending markets
– Corrective Waves:
These move against the main trend and consist of three waves, labeled A, B, and C.
Corrective waves represent pauses or retracements in the trend.
Fractal Nature
Elliott Wave patterns are fractal, meaning they appear on various timeframes, from long-term charts to short-term intraday charts.
This allows traders to use the theory in multiple market conditions.
Identifying Wave Patterns and Forecasting Market Moves
Really experienced day traders use Elliott Wave Theory to identify wave patterns and predict market movements.
Here’s how they do it:
– Wave Identification:
Traders identify the current wave count to determine if the market is in an impulse or corrective phase.
This involves analyzing market structures and recognizing wave patterns that fit the Elliott Wave framework.
– Wave Rules:
Specific rules help validate wave patterns.
For instance, Wave 3 is never the shortest impulse wave, and Wave 4 never overlaps Wave 1 in a traditional sequence.
– Extensions and Truncations:
Impulse waves may have extensions where one wave is significantly longer than others.
Truncations occur when the fifth wave doesn’t extend beyond the third wave, indicating a potential reversal.
– Fibonacci Relationships:
The theory often uses Fibonacci ratios to predict wave lengths.
For example, Wave 2 typically retraces 50% to 61.8% of Wave 1, and Wave 3 often extends 161.8% of Wave 1.
Case Study:
Elliott Wave in Equity Markets
Scenario:
A trader analyzes a stock market that has been in a strong bullish trend.
Using Elliott Wave Theory, the trader identifies the market as currently in Wave 4 of a five-wave impulse sequence.
Analysis:
– Wave Identification:
The trader confirms the wave count by recognizing previous impulse and corrective waves.
The market appears to be in Wave 4, suggesting a corrective phase.
– Fibonacci Analysis:
The trader uses Fibonacci retracement levels to identify potential support zones for Wave 4, predicting where the market might reverse and begin Wave 5.
– Confirmation with Other Indicators:
The trader notices support at a Fibonacci level with oversold RSI conditions, indicating a potential bullish reversal.
– Forecast:
Based on Elliott Wave Theory, the trader expects Wave 5 to follow, potentially extending beyond the previous Wave 3 high.
Outcome:
The market finds support at the identified Fibonacci level and reverses upward, confirming the trader’s wave count and analysis.
The trader enters a long position, capturing the subsequent Wave 5 move for a profitable trade.
Statistical and Mathematical Models
1. Linear Regression:
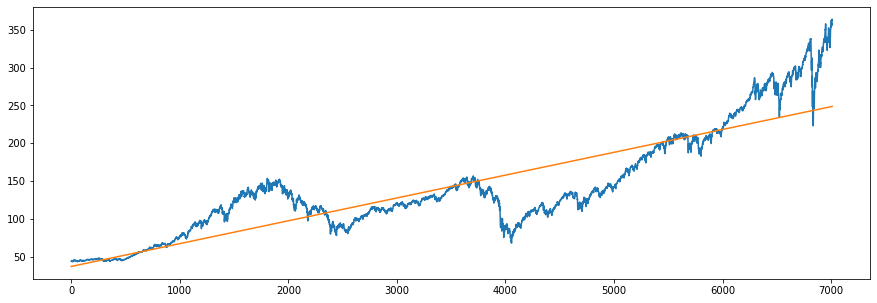
Linear regression is a technique that involves fitting a straight line through a set of price data points.
This line helps indicate the general direction of the market trend.
By analyzing the slope of the line, traders can understand the strength and direction of the trend and identify potential reversal points.
Example:
A trader applies linear regression to a stock chart to find a clear trend.
If the stock price is above the regression line, it may indicate an upward trend, while a price below the line suggests a downward trend.
2. Correlation Analysis:
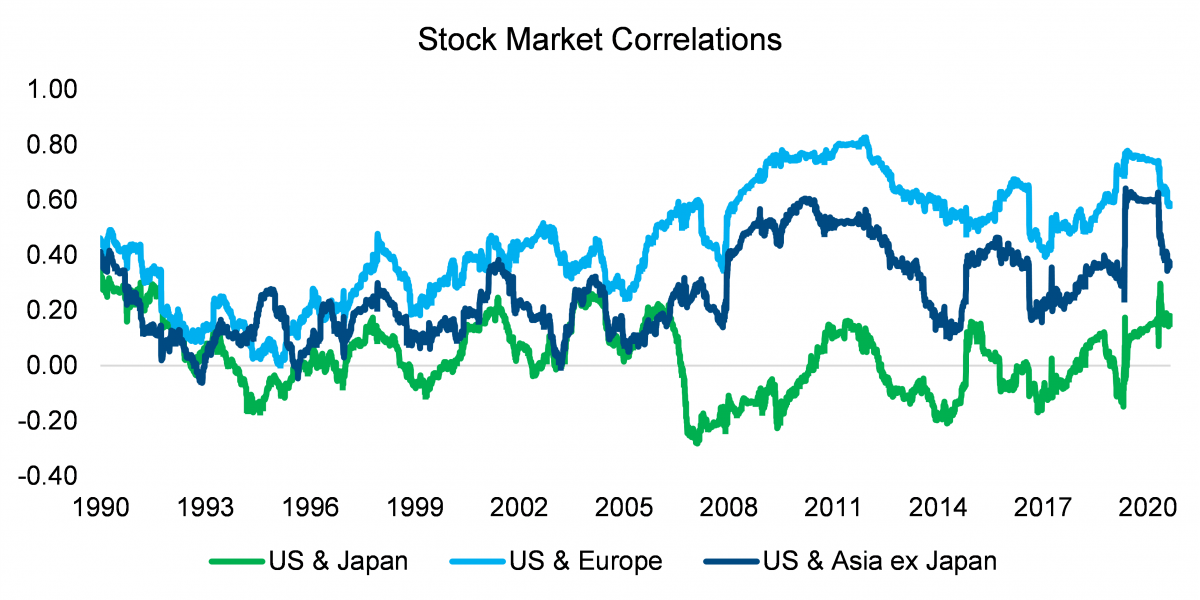
Correlation analysis measures the relationship between two assets, which can range from -1 (perfect negative correlation) to +1 (perfect positive correlation).
Traders use correlation to diversify portfolios and identify relationships between different markets or assets.
Example:
A trader might examine the correlation between a tech company’s stock and the NASDAQ index.
If there’s a strong positive correlation, the stock is likely to move in tandem with the index.
Using Statistical Models to Predict Market Behavior
Advanced traders use statistical models to predict market behavior and develop trading strategies.
Here are some popular models:
– Time Series Analysis:

This involves using historical price data to forecast future market movements.
Models like ARIMA (AutoRegressive Integrated Moving Average) capture patterns, trends, and seasonality in data.
Example:
A trader uses ARIMA to analyze a currency pair’s price history, identifying trends that can forecast future price movements.
– Machine Learning Models:
Machine learning algorithms, such as neural networks and support vector machines, analyze large datasets to identify patterns and make predictions.
These models can adapt to changing market conditions, improving accuracy over time.
Example:
A trader employs a machine learning model to sift through vast amounts of historical stock data, predicting potential price movements and optimizing trading strategies.
Example:
Quantitative Analysis for Risk Management
Scenario:
A hedge fund manager is developing a risk management strategy for a diversified portfolio.
Using statistical models, the manager aims to quantify risk and optimize asset allocation.
Analysis:
– Risk Metrics:
The manager calculates metrics such as Value at Risk (VaR) and Conditional Value at Risk (CVaR) to assess potential losses in extreme market conditions.
– Correlation Analysis:
The manager then evaluates the correlations between portfolio assets, identifying potential diversification benefits to reduce overall risk.
– Scenario Analysis:
The manager conducts scenario analysis to further evaluate the portfolio performance under various market conditions, identifying potential risks and opportunities.
Outcome:
The manager successfully optimizes the portfolio, balancing risk and return through data-driven decision-making.
The statistical models provide valuable insights into risk management, enhancing portfolio performance.
Algorithmic Trading and Automated Systems
Algorithmic trading, or algo trading, involves using computer algorithms to execute trades based on predefined criteria.
This advanced approach leverages technical analysis, statistical models, and machine learning to optimize trading strategies and improve execution speed.
Introduction to Algorithmic Trading
1. Automated Execution:
Algorithms execute trades automatically, reducing the impact of human emotions and errors.
This leads to consistent and disciplined trading decisions.
2. Speed and Efficiency:
Algorithms can analyze vast amounts of data and execute trades in milliseconds, taking advantage of fleeting market opportunities.
3. Backtesting and Optimization:
Traders can backtest algorithms against historical data, optimizing strategies for improved performance and reduced risk.
Developing Trading Algorithms Based on Technical Analysis
Advanced day traders and investors develop algorithms that incorporate technical analysis techniques to identify trading opportunities and execute trades automatically.
Here are some key steps on how to do it:
– Define Strategy:
Day traders define a strategy based on technical indicators, patterns, and rules.
For example, a trader might develop an algorithm that buys when the 50-day EMA crosses above the 200-day EMA and sells when it crosses below.
– Select Indicators:
Traders choose technical indicators that align with their strategy, such as moving averages, RSI, or MACD.
These indicators help identify entry and exit points.
– Backtest and Optimize:
Traders always backtest the algorithm against historical data, optimizing parameters to improve performance.
This involves adjusting indicator settings, stop-loss levels, and other variables.
– Deploy and Monitor:
Once optimized, the algorithm is deployed in live markets.
Traders monitor performance and make adjustments as needed to adapt to changing market conditions.
Case Study:
Success Stories of Algorithmic Trading
Scenario:
A quantitative trading firm develops an algorithmic trading strategy for high-frequency trading (HFT) in the forex market.
The algorithm leverages statistical models and technical indicators to capitalize on short-term price fluctuations.
Analysis:
– Algorithm Design:
The algorithm incorporates statistical models to predict short-term price movements, using technical indicators for entry and exit signals.
– Execution Speed:
The algorithm executes trades in milliseconds, taking advantage of small price discrepancies across currency pairs.
– Risk Management:
The firm implements specific risk management protocols, including stop-loss orders and position sizing, to protect against significant losses.
Outcome:
The algorithmic trading strategy achieves consistent profits, demonstrating the potential of algorithmic trading in competitive markets.
The firm’s success highlights the importance of speed, efficiency, and data-driven decision-making in modern trading.
Importance of Continuous Learning and Adaptation
The financial markets are dynamic and constantly evolving, presenting new challenges and opportunities for day traders and investors everyday.
To stay competitive and successful, traders must commit to continuous learning and adaptation.
Here are some key reasons why ongoing education and flexibility are essential in mastering advanced technical analysis skills and techniques:
1. Market Evolution:
Financial markets are influenced by various factors, including technological advancements, economic policies, and geopolitical events.
Staying updated with these changes is crucial for traders to adjust their strategies and remain relevant.
2. Emerging Tools and Technologies:
The development of new tools and technologies, such as artificial intelligence and machine learning, continually enhances technical analysis capabilities.
Traders must learn how to incorporate these advancements into their strategies to improve decision-making and efficiency.
3. Adaptive Strategies:
Markets are subject to cycles and shifts in sentiment.
Advanced traders understand the importance of adapting their strategies to different market conditions, such as bull, bear, and sideways markets, to maximize their performance.
4. Risk Management:
Effective risk management is a cornerstone of successful trading.
Continuous learning allows traders to refine their risk management techniques, incorporating new insights and methodologies to protect their capital and minimize losses.
5. Networking and Collaboration:
Engaging with other traders, participating in forums, and attending workshops or seminars provide opportunities for learning and exchanging ideas.
Collaboration with like-minded professionals fosters innovation and offers new perspectives on technical analysis.
Final Thoughts
Mastering advanced technical analysis skills and techniques requires dedication, discipline, and a willingness to learn from both successes and failures.
Day traders and investors who invest time and effort into developing their technical analysis skills can gain a competitive edge, enabling them to navigate the complexities of financial markets with confidence and precision.
As you continue your journey in technical analysis, remember that the key to success lies in combining theoretical knowledge with practical experience.
Analyze charts, experiment with different techniques, and adapt your strategies to the ever-changing market landscape.
With persistence and commitment, you can achieve mastery in technical analysis and unlock the potential for consistent trading success.
Click Here For Our Sources
Sources
1. Investopedia – Technical Analysis:
https://www.investopedia.com/technical-analysis-4689753
2. StockCharts – ChartSchool:
https://school.stockcharts.com/doku.php?id=technical_indicators
3. TradingView – Ideas and Scripts:
https://www.tradingview.com/ideas/
4. Elliott Wave International – Free Resources:
https://www.elliottwave.com/ElliottWaveTV
5. CMT Association – Chartered Market Technician Program:
6. NinjaTrader – Algorithmic Trading:
https://ninjatrader.com/AlgorithmicTrading
7. QuantStart – Quantitative Trading Articles:
https://www.quantstart.com/articles
8. Khan Academy – Finance and Capital Markets:
https://www.khanacademy.org/college-careers-more/finance-and-capital-markets
9. BabyPips – Forex Trading:
https://www.babypips.com/learn/forex
10. Bloomberg – Markets:
Leave a Reply
You must be logged in to post a comment.