Understanding Support and Resistance in Day Trading

Click Here To Save Time
Time Saver
Support and resistance levels are fundamental concepts in technical analysis and day trading that highlight price points where assets may reverse or pause in a trend.
Traders use charts, indicators, and volume analysis to pinpoint key support and resistance levels in the financial market.
Effective trading strategies utilize these levels for breakout and range-bound price movement which is crucial for optimizing day trading and investing outcomes.
Case studies from stock markets, futures, forex, and cryptocurrency illustrate the practical application of support and resistance.
Traders should consider psychological levels, like big round numbers, which can act as barriers or supports in the stock market.
Proper use of support and resistance levels helps traders manage their risk and set stop-loss and take-profit orders in effective areas on the chart.
Introduction
In the world of technical analysis, understanding support and resistance is crucial for anyone involved in day trading or investing.
These concepts provide day traders and investors with the appropriate tools needed to make informed decisions in the stock market and other financial markets.
In this comprehensive guide, we will delve into the principles of support and resistance, showcasing their importance through practical examples and case studies.
What is Support and Resistance?
Support and resistance are fundamental concepts that help day traders predict future price movements of stocks and other financial assets.
These levels act as psychological barriers, where price movements tend to pause or reverse. For any day trader or investor, mastering these concepts is key to being successful in the long run.
Support
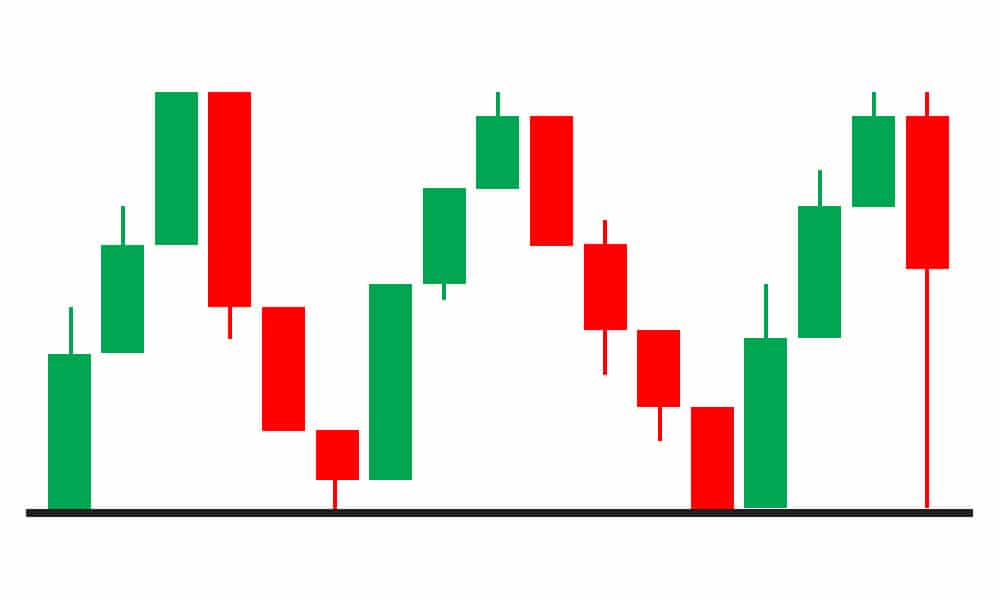
Support is a price level at which there is a lot of buying pressure that is strong enough to potentially prevent further declines in an asset’s price.
Imagine a rubber ball bouncing on the floor; the floor represents the support level. Traders expect a stock to “bounce” back up from this point.
Example: If a stock frequently falls to $50 and then rises, $50 is a support level.
Recognizing these levels is vital for both day traders and investors who want to enter the market at “perfect” price points, ensuring that they buy stocks when prices are likely to rise.
Resistance
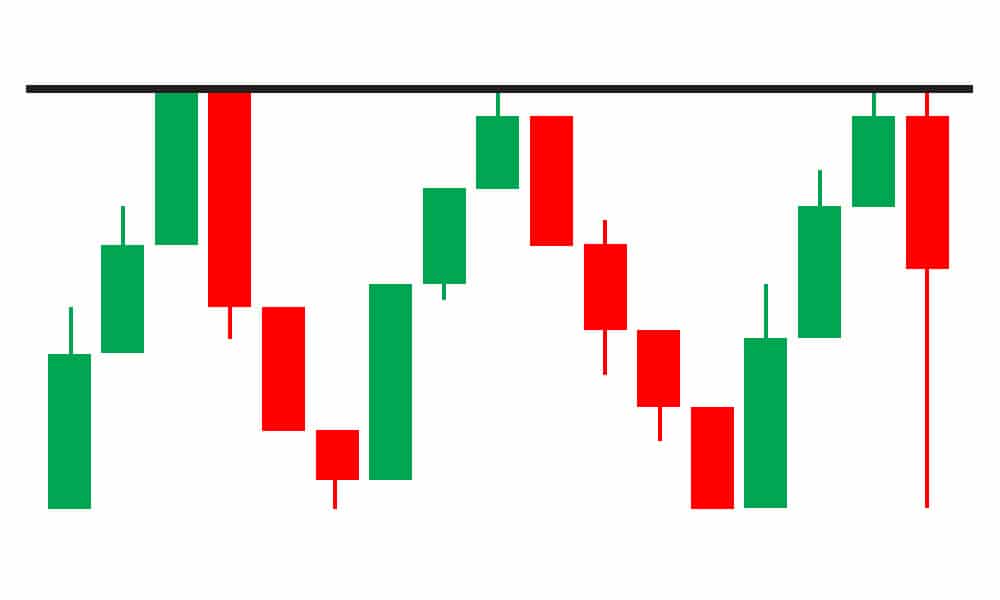
Resistance, on the other hand, is a price level where selling pressure severely outweighs buying pressure, preventing the stock’s price from rising further.
This can be visualized as a ceiling that the price struggles to break through.
Example: A stock repeatedly climbs to $100 and then falls back down. Here, $100 serves as a resistance level.
For day traders and investors, identifying resistance is also critical for deciding when to sell stocks and secure profits in an effective manner.
Importance in Technical Analysis
Support and resistance levels are pivotal in technical analysis for several reasons:
– Trend Identification: Recognizing these levels helps identify trends and potential reversal or pause points.
– Entry and Exit Points: Day traders and investors use these levels to determine when to enter or exit trades, optimizing their investment strategies to secure the most amount of profit as possible.
– Risk Management: By understanding these levels, day traders and investors can set stop-loss orders to minimize potential losses and take-profit orders to effectively secure their gains.
Types of Support and Resistance
Support and resistance levels come in many different forms, each offering different insights into market behavior. Here, we will explore the primary types of support and resistance.
Horizontal Support and Resistance
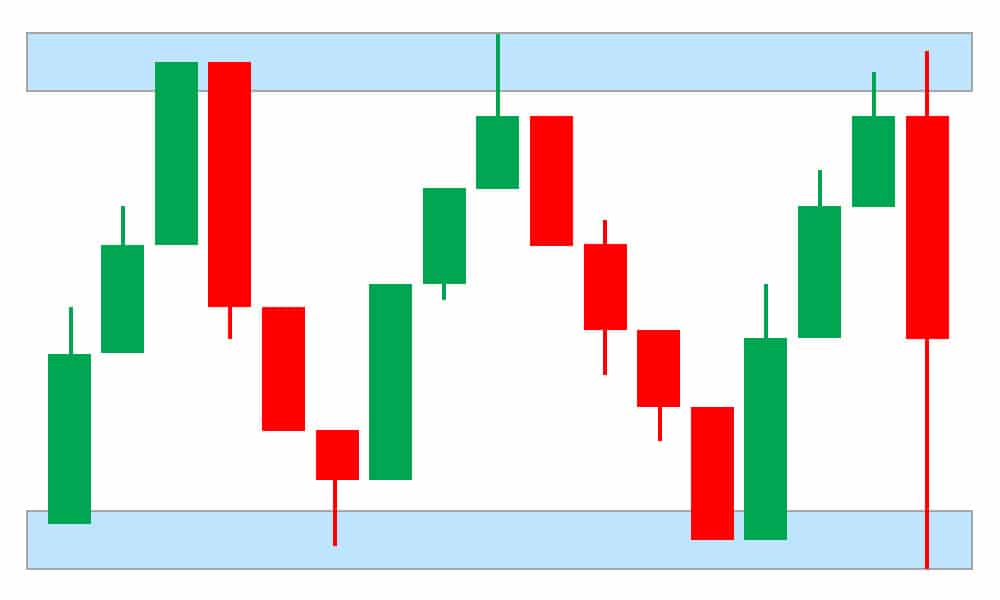
Horizontal support and resistance are the most straightforward types to identify on a chart. These levels remain constant over time, marked by horizontal lines at price points where the asset repeatedly finds support or resistance.
Example: If a stock consistently finds support at $30 and faces resistance at $40, traders can use these levels to place their trades.
Trendline Support and Resistance
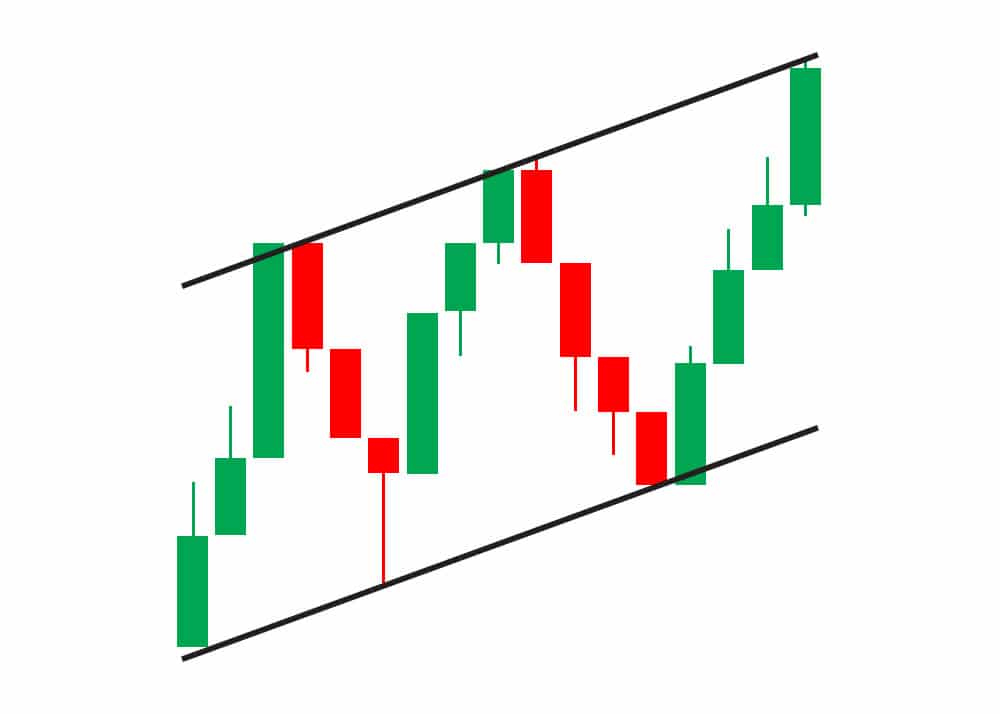
Trendlines are diagonal lines drawn across significant highs or lows, representing dynamic support and resistance levels that change over time. These lines help day traders identify trends and potential reversal points within those trends.
Example as Support and Resistance: An upward trendline might act as support, while a downward trendline could serve as resistance.
Moving Averages as Support and Resistance
Moving averages (MAs) smooth out price data, revealing trends by averaging past price movements.
They can also act as a dynamic support and resistance levels. Commonly used MAs include the 50-day simple moving average (SMA) and the 200-da exponential moving average (EMA).
Example: In an uptrend, the 50-day SMA might serve as support, while in a downtrend, the 200-day SMA could act as resistance.
Psychological Levels
Psychological levels are price points that day traders and investors consider to be significant due to their round numbers or historical importance.
These levels often act as support or resistance because traders tend to place buy or sell orders at these prices.
Example: Price levels like $0.50, $500, $100, $1,000, $150, and $1,500 often act as psychological levels in the stock and cryptocurrency markets.
Identifying Support and Resistance Levels
Identifying support and resistance levels involves using a combination of indicators, techniques, and analysis to make informed trading decisions.
Methods and Tools
Price Charts: The most basic tool for identifying support and resistance is a price chart. Price charts are usually comprised of candlesticks that make up candlestick patterns.
Day traders and investors use these charts to visualize historical price movements and identify key levels.
Indicators: Indicators such as moving averages, Fibonacci retracement and extension, pivot points, and Bollinger Bands help identify potential support and resistance levels.
Volume Analysis: Volume plays a very crucial role in confirming support and resistance levels. High trading volume at a specific price level can reinforce the strength and confidence of that level.
Chart Patterns
Chart patterns, such as head and shoulders, double tops, and triangles, often indicate support and resistance levels.
These patterns provide visual cues for potential price reversals or continuations.
Example: A head and shoulders pattern with a neckline at $150 can indicate a very strong resistance.
Volume Analysis
Volume analysis involves examining the trading volume at different price levels. Higher volume at a support or resistance level suggests that the level is more likely to hold.
Example: If a stock experiences high trading volume at $75, it may indicate that the support level will hold.
The Role of Support and Resistance in Trading Strategies
Support and resistance levels are integral to various trading strategies, providing traders with opportunities to profit from price movements.
Breakout Trading

Breakout trading involves entering a trade when the price breaks through a significant support or resistance level.
Day traders anticipate that the price will continue in the breakout direction, leading to a profitable trade.
Example: If a stock breaks above a resistance level at $100, traders may enter a long position, expecting the price to rise further.
Range-Bound Trading
Range-bound trading involves identifying assets that trade within a specific range, with support and resistance levels acting as boundaries.
Day traders buy at support and sell at resistance, profiting from price fluctuations within the range.
Example: If a currency pair trades between 1.2000 and 1.2500, traders can enter long positions at 1.2000 and short positions at 1.2500.
Using Indicators with Support and Resistance
Indicators can enhance support and resistance trading strategies by providing additional confirmation signals.
Commonly used indicators include Moving Averages, Bollinger Bands, Fibonacci Levels, RSI (Relative Strength Index), MACD (Moving Average Convergence Divergence), and stochastic oscillators.
Example: An RSI reading above 70 near a resistance level may indicate overbought conditions, suggesting a potential reversal.
Case Studies
Case studies offer practical insights into how support and resistance are applied across different financial markets. Here, we explore examples from the stock market, forex, and cryptocurrency markets, showcasing real-world scenarios.
Example 1: Support and Resistance in Stock Trading
Case Study: Apple Inc. (AAPL)
Apple Inc. (AAPL) provides a classic example of how support and resistance levels can impact stock trading. Let’s explore a period when AAPL stock demonstrated clear support and resistance.
Support Level: $130
Resistance Level: $150
During this period, AAPL frequently found support at $130, bouncing higher each time it approached this level. On the other hand, $150 acted as a strong resistance, with the stock struggling to break above it.
Breakout Event: After several attempts, AAPL eventually broke through the $150 resistance level on increased trading volume, leading to a significant upward trend.
Lesson Learned: This case study highlights the importance of volume in confirming breakout signals. Traders who identified the breakout and acted accordingly could have capitalized on the upward movement.
Example 2: Forex Market Analysis
Case Study: EUR/USD Currency Pair**
The EUR/USD currency pair is one of the most traded pairs in the forex market. Understanding support and resistance levels is crucial for successful trading in this market.
Support Level: 1.2000
Resistance Level: 1.2500
During a specific period, the EUR/USD pair traded within a range, with 1.2000 acting as strong support and 1.2500 as strong resistance.
Range-Bound Strategy: Traders could have profited by entering long positions at 1.2000 and short positions at 1.2500, capitalizing on the predictable price movements within the range.
Lesson Learned: Range-bound trading can be highly profitable when support and resistance levels are well-defined, allowing day traders to execute trades with confidence.
Example 3: Cryptocurrency Volatility
Case Study: Bitcoin (BTC)
Bitcoin (BTC) is known for its volatility, making support and resistance levels vital for trading decisions. Let’s analyze a period when BTC exhibited significant price movements.
Support Level: $30,000
Resistance Level: $40,000
During this period, Bitcoin experienced sharp price fluctuations, with $30,000 acting as strong support and $40,000 as strong resistance.
Breakout Event: Bitcoin eventually broke above the $40,000 resistance level, triggering a substantial bull run that attracted significant attention from day traders and investors.
Lesson Learned: In volatile markets like cryptocurrencies, breakouts from established support and resistance levels can lead to substantial price movements, offering lucrative trading opportunities.
Conclusion
Understanding support and resistance is essential for any day trader or investor aiming to make informed decisions in the financial markets.
These concepts form the backbone of technical analysis, providing valuable insights into market behavior and price movements.
By identifying key support and resistance levels, traders can anticipate potential reversals, breakouts, and trends, thereby enhancing their trading strategies.
Click Here For Our Sources
Sources
Investopedia – Support and Resistance Basics
– URL: https://www.investopedia.com/articles/technical/061801.asp
TradingView Blog – The Importance of Support and Resistance Levels in Trading
– URL: https://www.tradingview.com/blog/en/support-resistance-levels-trading-8402/
BabyPips – The Forex Market: Support and Resistance Levels
– URL: https://www.babypips.com/learn/forex/support-and-resistance-levels
CoinDesk – Bitcoin Technical Analysis: Support and Resistance
– URL: https://www.coindesk.com/learn/bitcoin-technical-analysis-support-and-resistance/
StockCharts – ChartSchool: Support and Resistance
– URL: https://school.stockcharts.com/doku.php?id=technical_indicators:support_and_resistance
FXStreet – How to Use Support and Resistance Levels in Forex Trading
– URL: https://www.fxstreet.com/education/how-to-use-support-and-resistance-levels-in-forex-trading
MarketWatch – Understanding Support and Resistance in Stock Market Trading**
Leave a Reply
You must be logged in to post a comment.