Technical Analysis: What Is That?
Click Here To Save Time
Time Saver
Whether or not you use technical analysis for day trading is completely up to you and your personal goals, preferences and risk tolerance.
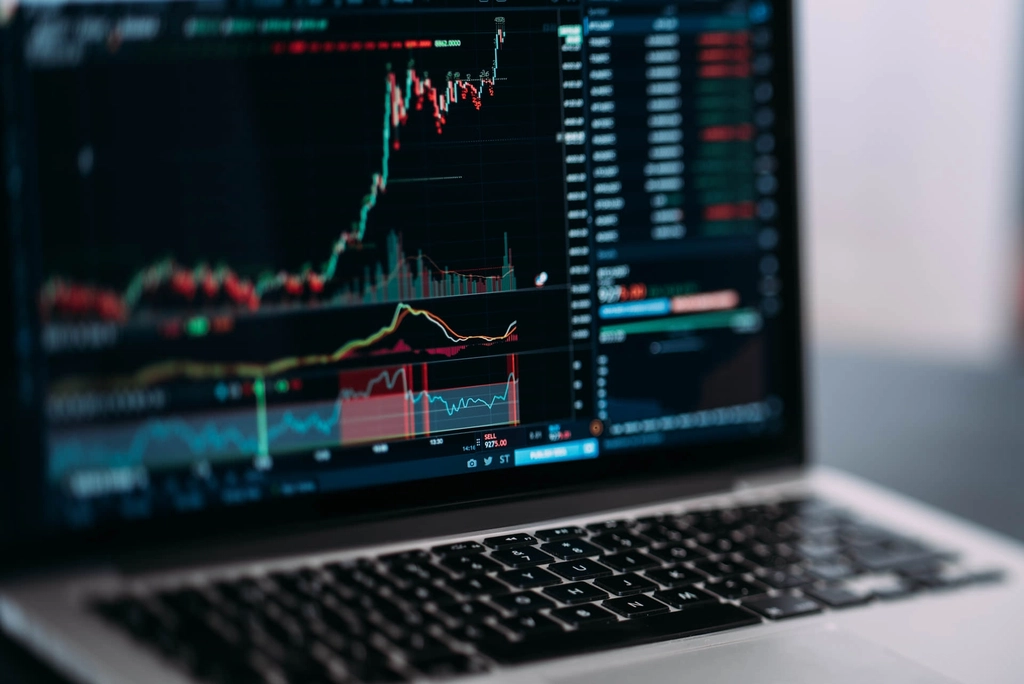
Technical analysis is studying the historical price movements and trading volume on charts to predict future price movements.
Technical Analysis gives you insights into market trends and patterns so you can make informed decisions on great entry and exit points.
Technical analysis is for traders who like to be systematic and like to analyze for trading opportunities.
Technical analysis takes skill, practice and continuous learning to be able to read the market signals correctly.
Integrating technical analysis with fundamental analysis and great risk management can increase overall trading strategy effectiveness.
What Is Technical Analysis?
Technical analysis is a way of looking at different securities in the financial markets by looking at statistics from market activity, like past prices and volumes.
Technical Analysis is ultimately trying to forecast future price movements based on historical patterns and data, assuming markets repeat themselves.
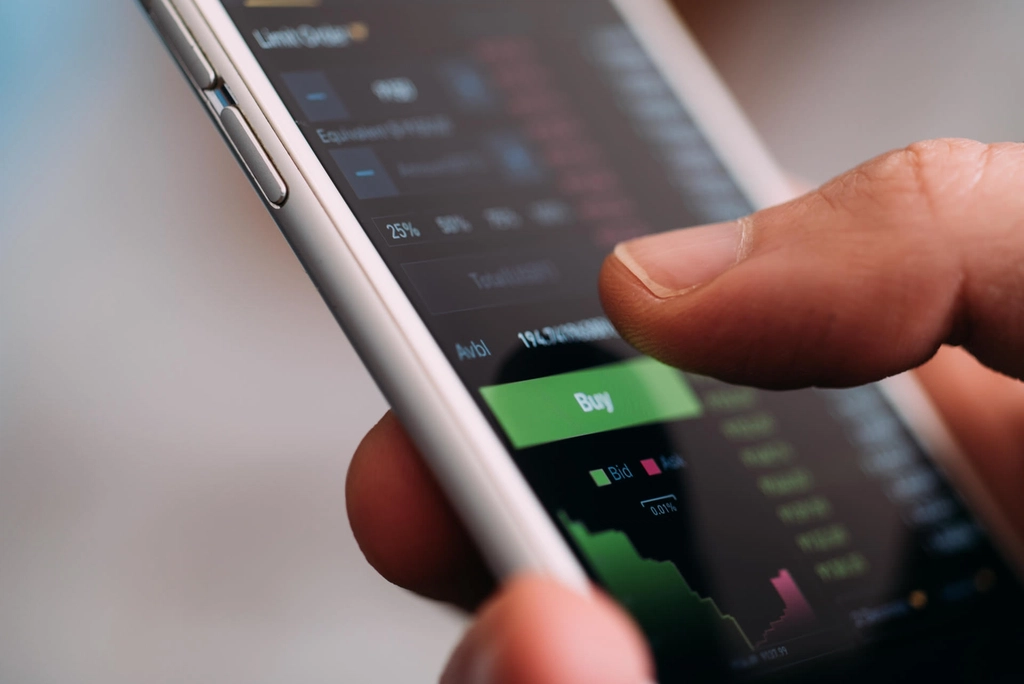
Day Traders and investors use technical analysis to make informed decisions on buying and selling stocks, currencies or commodities.
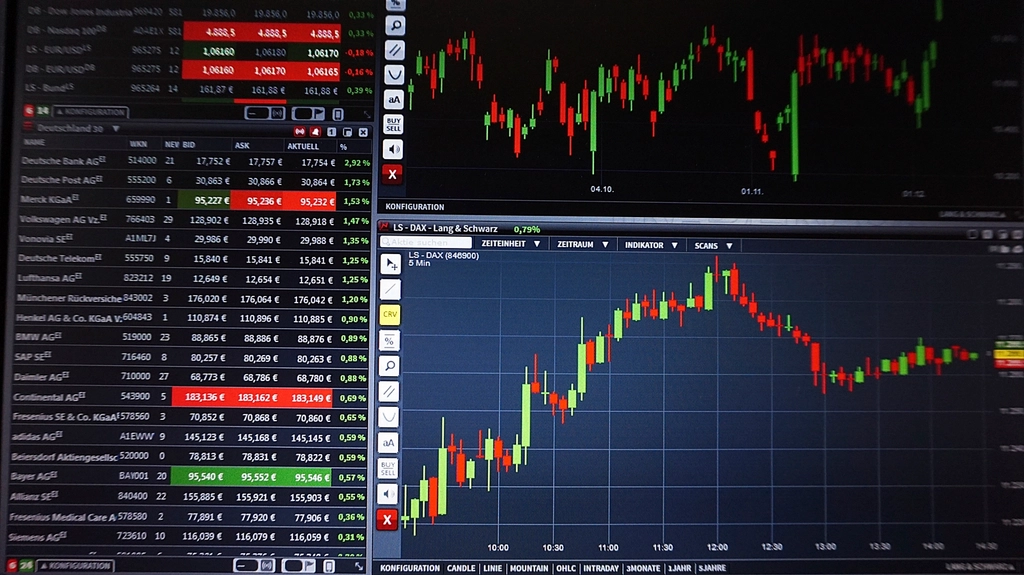
By looking at charts and graphs day traders and investors can identify support and resistance levels and other technical patterns that may be opportunities or risks.
Knowing technical analysis can help day traders and investors alike to navigate the financial markets better.
How Is Technical Analysis Used In Day Trading?
Technical analysis is a key element in day trading as it allows you to analyze price movements and make decisions in short time frames.
Day traders use technical indicators like moving averages, RSI and MACD to get in and out of their trades quickly.
These indicators help day traders to determine price trends, momentum and volatility, and to predict short term price movements.
By looking at charts and candlestick patterns like triangles, flags and head and shoulders you can trade the smaller moves in the price and profit largely.
Technical analysis in day trading gives you insight in the market behavior and allows you to trade while managing your risk efficiently.
Day Trading Indicators
Day trading indicators are the tools of the trade for traders to analyze the market and make better informed decisions during the day.
They include popular ones like moving averages which smooth out price data to show trends in the price over a period of time set by the trader.
RSI measures the speed and change of price movement showing whether the price is currently overbought, oversold or just right.
MACD (Moving Average Convergence Divergence) shows the changes in momentum of the price based on the relationship between both short and long term moving averages set by the trader.
Support and Resistance levels are areas that day traders mark on their chart where the price had previously been before multiple times and big movements occurred.
Traders also use different volume indicators to measure the strength of price movement as well as to confirm trends and if a bigger move is likely to happen.
By understanding and reading these different day trading indicators, you can improve your strategy, find opportunities and manage risk in all types of market conditions.
Is Technical Analysis The Holy Grail Of Day Trading?
Technical analysis is a very useful tool for day trading, and even investing, but it is not the holy grail or a guarantee of success to day trading.
Technical analysis allows you to analyze historical price data and market trends to make decisions on buying and selling within short time frames. But its effectiveness depends on market conditions, external factors and your personal trading strategy.
Day trading success is a combination of both technical analysis, fundamental analysis, risk management and psychological discipline. That is the true holy grail.
Use technical analysis as part of your overall trading approach and adapt your strategy to real market conditions and continuous learning to stay profitable.
Is Technical Analysis Better Than Fundamental Analysis?
Technical vs fundamental analysis is truly all about different ways of looking at investments.
Technical analysis looks at past market data and patterns to predict future price movements using charts and indicators.
Fundamental analysis looks at a company’s financials, earnings, revenue and market position to determine its intrinsic value.
Both have their uses: technical analysis is great for short term day trading and timing entries and exits while fundamental is a lot better for longer term investment potential.
The choice between them really just depends on what you want, your situation, and how long and how you like to invest. Combining both technical and fundamental analysis can give you a balanced view to make informed investment decisions.
Warren Buffett

Warren Buffett is an investor who uses fundamental analysis as the foundation of his approach to investing. Warren Buffett looks at a company’s financials, management, competitive advantages and “moat” to determine its intrinsic value and growth potential.
He is looked at as one of the greatest investors. Buffett also is the chairman and CEO of Berkshire Hathaway Inc., the most expensive stock in the market.
Warren Buffett’s approach to fundamental analysis is very disciplined and focuses on the underlying business, not the short term market noise. Buffett’s success proves that research and a patient investment approach based on fundamental analysis works.
Paul Tudor Jones II

Paul Tudor Jones II is a big name in the financial world, mainly known for his big impact on hedge funds and philanthropy.
As the founder of Tudor Investment Corporation, Jones has built a reputation as a great investor with an amazing sense of the bigger picture using technical analysis. Paul Tudor Jones II was famously known for predicting the 1987 market crash and has since navigated many market cycles with great precision, having multiple triple-digit return years.
Beyond being a great investor he is also known for his philanthropy, especially in education and community development. Today Paul Tudor Jones II still moves markets globally and is a big deal in business and charity.
Risk Management In Day Trading
Risk management in day trading is key to limiting a trader’s losses and maximizing gains in the financial markets.
Day traders use several different strategies to mitigate risks, including setting hard stop losses (highly recommended) on individual trades as well as diversifying their portfolio to spread risk across multiple different assets.
Traders also use technical analysis tools like moving averages, support and resistance levels and volatility indicators to find great entry and exit points. Risk management is also about managing leverage to not overexpose positions and using risk reward ratios to make sure gains outweigh losses.
By following these rules day traders can manage risk and increase their chances of being profitable over time to stay in the game.
Day Trading Psychology
Day trading psychology is a very important aspect of day trading that you wouldn’t initially expect.
It’s about understanding and managing the emotions and different states of mind that influence your trading decisions. Fear, greed and impatience are the 3 biggest emotions that lead to irrational decisions and the biggest losses.
Successful day traders use different techniques to keep themselves disciplined. Day traders stick to the trade plans they made before opening a position, set advanced orders and walking away, and use past experiences to develop a “thick skin” to their losses.
By mastering your psychology, you can make better informed decisions to manage risk and increase your chances of long term success in the day trading game by a significant amount.
Day Trading Strategies
Day trading strategies are essential to being able to profit in the financial markets.
Successful day traders use many different strategies to trade short and long term price movements to make the most amount of profit possible. These strategies include technical analysis tools like moving averages, Bollinger Bands, supports and resistances and candlestick patterns to find the perfect entry and exit points based on trends and momentum.
Traders also use risk management techniques like setting a stop loss to limit their losses to be controlled and use leverage very carefully to get the biggest possible return while also minimizing the downside. Staying informed of market news and events that can move prices is another way day traders make great trading decisions.
By combining working day trading strategies with solid risk management and market analysis, you will be on the right path towards being a successful day trader.
Is Technical Analysis A Scam?
The debate about whether technical analysis is a scam is a pretty big topic in the financial world.
Technical analysis is studying historical price charts and trading volumes to predict future market moves.
Day traders that use technical analysis say it gives you valuable insights into trends and patterns to base your trading decisions on. Haters say it’s junk, subjective and unscientific. Whatever the opinion, many traders find technical analysis useful when used with fundamental analysis and risk management to give them the best outcome.
Ultimately it’s really down to individual skill, experience, situation and just being able to interpret the data correctly. So whether technical analysis is a scam or not is up to the trader in the fast moving world of finance.
Should I Use Technical Analysis
Whether you use technical analysis in day trading solely depends on your personal goals, preferences and risk tolerance.
Technical analysis is studying historical price charts and volume to forecast future financial market moves. It can give you insight into market trends and patterns to make well informed decisions on entry and exit points.
If you like systems and processes, technical analysis is perfect for identifying opportunities and managing your risk. But you must remember that technical analysis is not scientific and requires skill, practice and lots of continuous learning to be able to efficiently read the markets.
Whether you should use technical analysis or not is completely up to you and your trading style and comfort with the methods and tools.
Combining technical analysis with fundamental analysis and sound risk management can enhance your overall strategy and potentially improve your results in becoming a day trader.
Like Us? Follow Us!
Pages
Leave a Reply
You must be logged in to post a comment.